NIFTY TRADING PLAN – 07-Oct-2025
Nifty closed at 25,072, showing mild consolidation after a strong upside stretch over the past few sessions. The price is currently hovering near a short-term equilibrium band of 25,015 – 25,049, which will act as the first control zone for tomorrow’s intraday direction.
📊 Key Technical Levels:
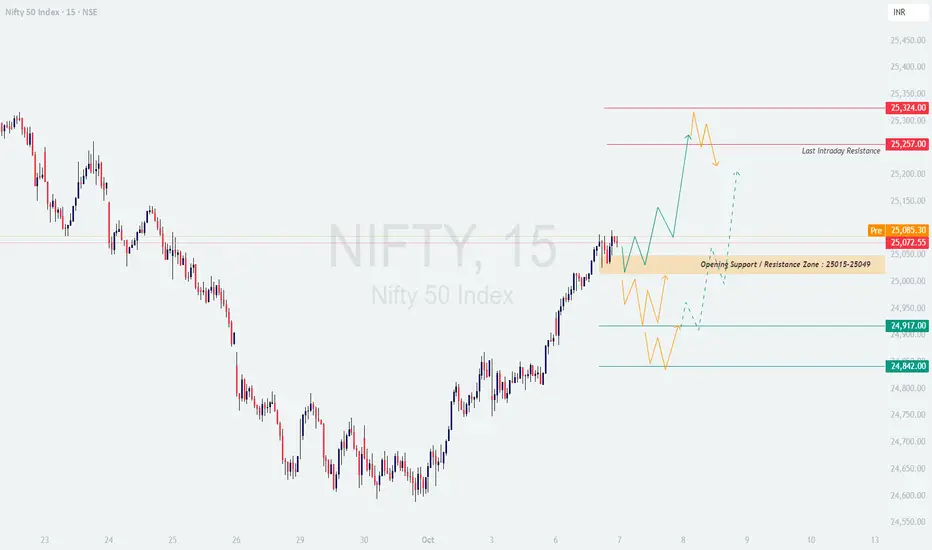
Opening Support / Resistance Zone: 25,015 – 25,049
Last Intraday Resistance: 25,257
Major Resistance: 25,324
Last Intraday Support: 24,917
Major Support: 24,842
🚀 Scenario 1: Gap Up Opening (100+ points)
📘 Educational Note: Gap-ups near resistance are often emotional reactions to overnight sentiment. Always validate breakouts with strong volume and sustained price action instead of chasing the open.
⚖️ Scenario 2: Flat Opening (within ±100 points)
📘 Educational Note: Flat openings often test traders’ patience. The best trades come after early volatility settles and the breakout/breakdown direction becomes clear.
📉 Scenario 3: Gap Down Opening (100+ points)
📘 Educational Note: Gap-downs often attract panic selling — but smart traders wait for support confirmation before taking fresh positions. Watch candle structure and volume behavior carefully.
🛡️ Risk Management Tips for Options Traders
📌 Summary & Conclusion
📈 Nifty remains in a short-term bullish structure, but traders should respect the overhead resistance near 25,257–25,324. The 25,015 zone acts as the short-term pivot for directional clarity. Disciplined entries, patience, and position sizing will be key to riding tomorrow’s move effectively.
⚠️ Disclaimer: This analysis is for educational purposes only. I am not a SEBI-registered analyst. Please conduct your own analysis or consult a financial advisor before making trading decisions.
Nifty closed at 25,072, showing mild consolidation after a strong upside stretch over the past few sessions. The price is currently hovering near a short-term equilibrium band of 25,015 – 25,049, which will act as the first control zone for tomorrow’s intraday direction.
📊 Key Technical Levels:
Opening Support / Resistance Zone: 25,015 – 25,049
Last Intraday Resistance: 25,257
Major Resistance: 25,324
Last Intraday Support: 24,917
Major Support: 24,842
🚀 Scenario 1: Gap Up Opening (100+ points)
- [] If Nifty opens above 25,150, the immediate upside target becomes the 25,257 resistance zone.
[] A strong breakout with volume above 25,257 can extend the rally toward 25,324 — this zone may act as a short-term supply region.
[] However, if early buying fades near 25,257–25,324, profit booking pressure could emerge, pulling prices back to the 25,050 zone.
[] Aggressive traders should wait for a 15-min candle close above 25,257 to confirm breakout strength before taking long positions.
📘 Educational Note: Gap-ups near resistance are often emotional reactions to overnight sentiment. Always validate breakouts with strong volume and sustained price action instead of chasing the open.
⚖️ Scenario 2: Flat Opening (within ±100 points)
- [] A flat opening near 25,050 will keep Nifty inside the Opening Support/Resistance zone (25,015 – 25,049).
[] Sustained trading above 25,049 will keep intraday momentum positive, with potential targets of 25,150 → 25,257.
[] On the downside, a breakdown below 25,015 may drag the index towards 24,917, where dip buyers could step in.
[] Let the first 30 minutes define direction — avoid premature trades during choppy early candles.
📘 Educational Note: Flat openings often test traders’ patience. The best trades come after early volatility settles and the breakout/breakdown direction becomes clear.
📉 Scenario 3: Gap Down Opening (100+ points)
- [] If Nifty opens near 24,950 or below, it will test the Last Intraday Support at 24,917.
[] A breakdown below 24,917 could extend weakness towards the 24,842 zone, which is a crucial support for bulls to defend.
[] If prices hold 24,842 and show a reversal candle pattern (like bullish engulfing or hammer), expect a rebound back toward 25,000+.
[] Avoid aggressive shorts below 24,842 without confirmation, as this level can trigger a sharp short-covering rally.
📘 Educational Note: Gap-downs often attract panic selling — but smart traders wait for support confirmation before taking fresh positions. Watch candle structure and volume behavior carefully.
🛡️ Risk Management Tips for Options Traders
- [] ⏱️ Avoid trading the first 15–30 minutes; allow volatility to stabilize.
[] 🛑 Use hourly candle close as SL validation instead of reacting to intraday spikes.
[] 💡 Near support/resistance zones, use Bull Call / Bear Put spreads instead of naked options to reduce theta risk.
[] 💰 Maintain a 1:2 or higher Risk-Reward Ratio; never enter trades without clear R:R visibility.
[] 🔄 Trail profits once Nifty moves 40–60 points in your favor to lock gains.
[] 🚫 Risk only 2%–3% of total capital per trade for consistent longevity.
📌 Summary & Conclusion
- [] Bullish Bias: Above 25,257, targets 25,324 → 25,400.
[] Neutral Zone: Between 25,015 – 25,049, expect sideways consolidation until breakout. - Bearish Bias: Below 24,917, weakness may extend towards 24,842.
📈 Nifty remains in a short-term bullish structure, but traders should respect the overhead resistance near 25,257–25,324. The 25,015 zone acts as the short-term pivot for directional clarity. Disciplined entries, patience, and position sizing will be key to riding tomorrow’s move effectively.
⚠️ Disclaimer: This analysis is for educational purposes only. I am not a SEBI-registered analyst. Please conduct your own analysis or consult a financial advisor before making trading decisions.
כתב ויתור
המידע והפרסומים אינם מיועדים להיות, ואינם מהווים, ייעוץ או המלצה פיננסית, השקעתית, מסחרית או מכל סוג אחר המסופקת או מאושרת על ידי TradingView. קרא עוד ב־תנאי השימוש.
כתב ויתור
המידע והפרסומים אינם מיועדים להיות, ואינם מהווים, ייעוץ או המלצה פיננסית, השקעתית, מסחרית או מכל סוג אחר המסופקת או מאושרת על ידי TradingView. קרא עוד ב־תנאי השימוש.