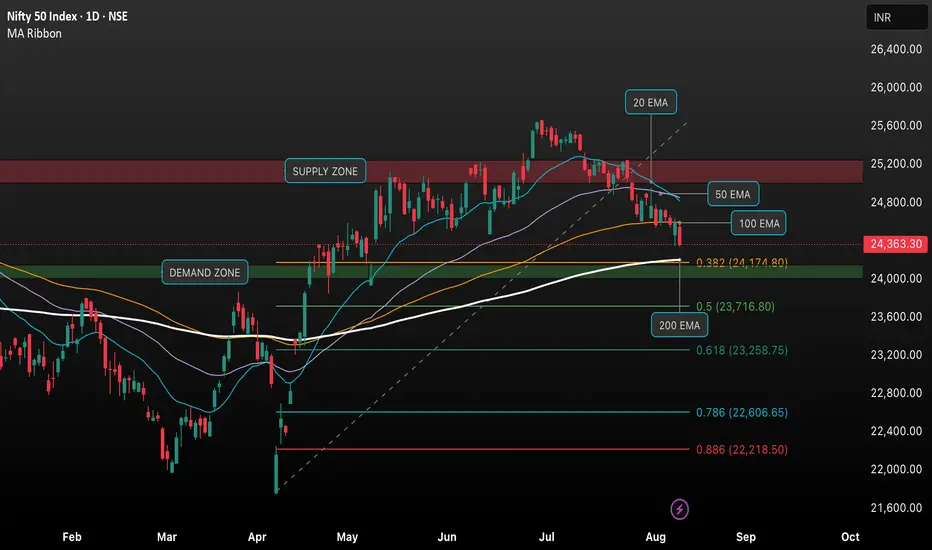
This chart presents the daily price action of the NIFTY 50 index using technical indicators and key support/resistance zones. The analysis includes:
• EMA Ribbon: Showing 20, 50, 100, and 200 EMAs, highlighting current trend direction.
• Supply Zone (Resistance): Marked near 25,200–25,600, where selling pressure is historically strong.
• Demand Zone (Support): Located around 24,100–24,400, indicating potential buying interest.
• Fibonacci Retracement Levels: Key support at 0.382 (24,174.80), 0.5 (23,716.80), and 0.618 (23,258.75) levels for swing trade reference.
• Current Price: 24,363.30, trending downward (-0.95%).
• Watch for price action near the Demand Zone and 200 EMA as critical support levels, as a break below may signal further downside.
• The chart is ideal for both swing and intraday traders assessing possible reversal or continuation setups.
כתב ויתור
המידע והפרסומים אינם אמורים להיות, ואינם מהווים, עצות פיננסיות, השקעות, מסחר או סוגים אחרים של עצות או המלצות שסופקו או מאושרים על ידי TradingView. קרא עוד בתנאים וההגבלות.
כתב ויתור
המידע והפרסומים אינם אמורים להיות, ואינם מהווים, עצות פיננסיות, השקעות, מסחר או סוגים אחרים של עצות או המלצות שסופקו או מאושרים על ידי TradingView. קרא עוד בתנאים וההגבלות.