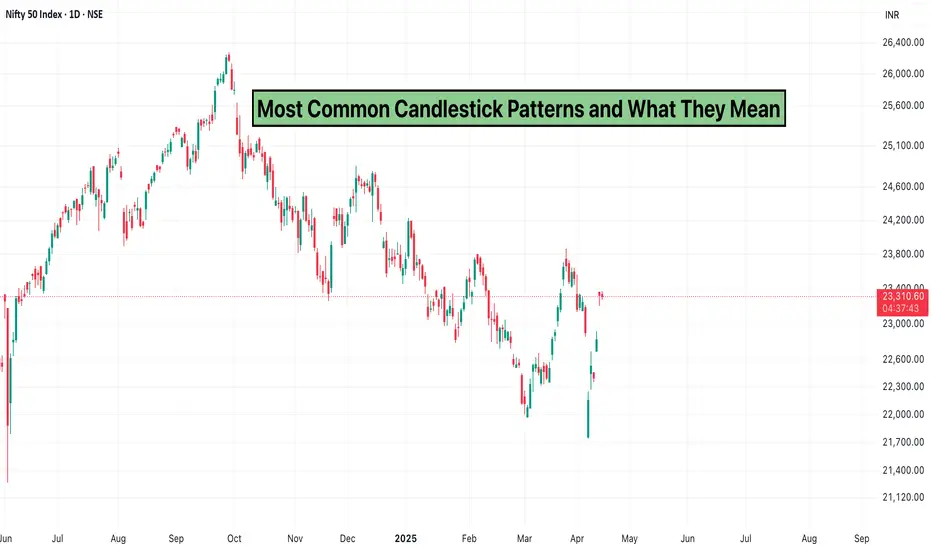
Candlestick patterns are one of the most widely used tools in technical analysis. They visually represent price movements and offer insights into market sentiment, potential reversals, and continuation patterns. Whether you're a beginner or an experienced trader, understanding the most common candlestick patterns can significantly improve your chart-reading skills.
1. Doji
A Doji forms when the opening and closing prices are nearly the same. It signals indecision in the market and can indicate a potential reversal when it appears after a strong trend.
2. Hammer
The Hammer is a bullish reversal pattern that appears after a downtrend. It has a small body and a long lower wick, showing that buyers stepped in to push the price higher.
3. Hanging Man
The Hanging Man looks like a Hammer but forms after an uptrend. It suggests that selling pressure is increasing and could signal a bearish reversal.
4. Bullish Engulfing
This two-candle pattern appears when a small red candle is followed by a larger green candle that completely engulfs it. It signals strong buying momentum and a potential bullish reversal.
5. Bearish Engulfing
The opposite of the Bullish Engulfing, this pattern forms when a small green candle is followed by a larger red candle. It indicates selling pressure and a possible trend reversal to the downside.
6. Morning Star
The Morning Star is a three-candle bullish reversal pattern. It consists of a long red candle, a small-bodied candle (indicating indecision), and a strong green candle. It typically appears at the bottom of a downtrend.
7. Evening Star
This is the bearish counterpart to the Morning Star. It includes a long green candle, a small-bodied candle, and a strong red candle. It usually forms at the top of an uptrend and signals a potential bearish reversal.
8. Shooting Star
A Shooting Star has a small body and a long upper wick. It appears after an uptrend and suggests that the price may start to fall due to growing selling pressure.
Conclusion
Recognizing these common candlestick patterns can help you better understand market dynamics and improve your timing for entries and exits.
While they’re powerful tools, always combine candlestick analysis with other indicators and market context for more reliable trading decisions.
Elevate your Trading Experience 🚀
📱 Download Dhan App on iOS and Android and Start Trading.
📱 Download Dhan App on iOS and Android and Start Trading.
כתב ויתור
המידע והפרסומים אינם מיועדים להיות, ואינם מהווים, ייעוץ או המלצה פיננסית, השקעתית, מסחרית או מכל סוג אחר המסופקת או מאושרת על ידי TradingView. קרא עוד ב־תנאי השימוש.
