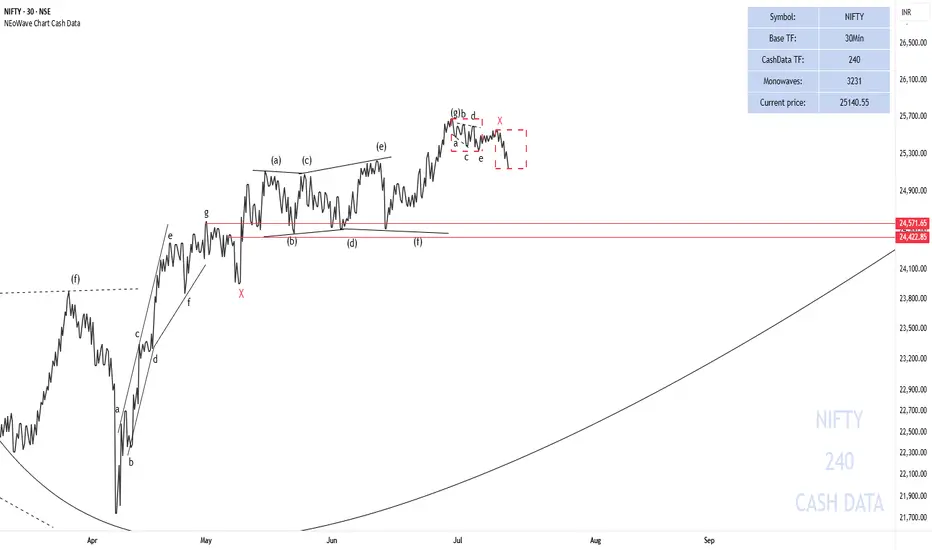
My first scenario is still valid and I think it is more likely to happen. It seems that Wave-g has ended from the second pattern and I think NIFTY50 will decline at least to the price range of the X-wave and there we need to check the waves again to see what pattern is forming. To confirm this scenario, a break below the key level of 25000 is very important.
I have also proposed a second scenario that this correction may be an X-wave and after that the price can eventually grow to 25680-26133 and spend time there to complete the third pattern. This scenario is also valid as long as the price remains above the level of 25000.
The price correction that is forming can be a double combination pattern like triangle - X - diametric or triangle - X - triangle.
Good luck
NEoWave Chart
Good luck
NEoWave Chart
כתב ויתור
המידע והפרסומים אינם אמורים להיות, ואינם מהווים, עצות פיננסיות, השקעות, מסחר או סוגים אחרים של עצות או המלצות שסופקו או מאושרים על ידי TradingView. קרא עוד בתנאים וההגבלות.
כתב ויתור
המידע והפרסומים אינם אמורים להיות, ואינם מהווים, עצות פיננסיות, השקעות, מסחר או סוגים אחרים של עצות או המלצות שסופקו או מאושרים על ידי TradingView. קרא עוד בתנאים וההגבלות.