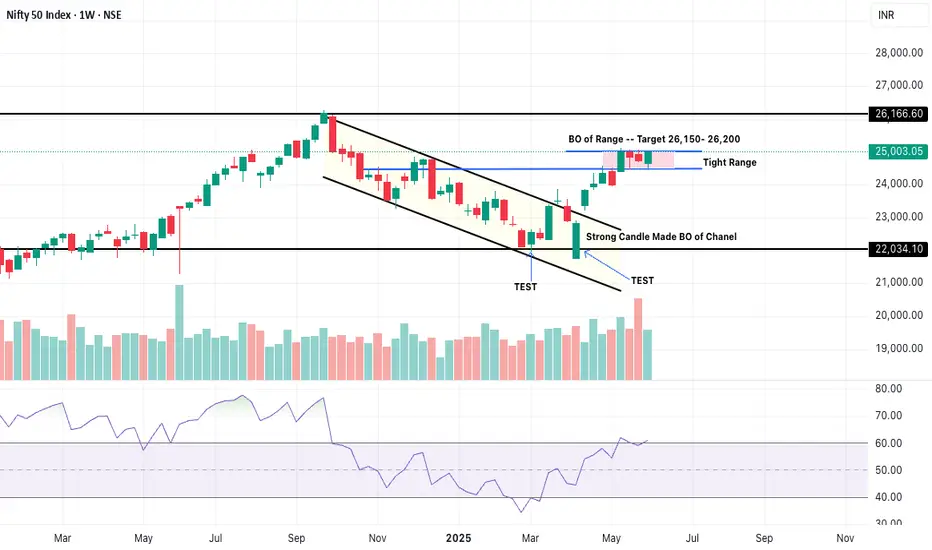
The Nifty 50 chart exhibits strong bullish momentum. The breakout from the downward channel, followed by consolidation in a tight range and then a breakout from that range, all point towards continued upward movement. The immediate target for this move is identified between 26,150 and 26,200, which is very close to a major resistance level at 26,166.60.
Potential Scenarios:
Continued Bullish Momentum: If the Nifty 50 can decisively break above the 26,166.60 resistance, it could signal further upside.
Resistance at Target: The price might face strong resistance at the 26,150-26,200 range and the 26,166.60 level, potentially leading to a pullback or further consolidation.
Support Levels to Watch: If there's a pullback, the top of the "Tight Range" and then the 25,000 psychological level, followed by the top of the broken channel, would be key support levels to watch.
Disclaimer: This analysis is based solely on the provided image and does not constitute financial advice. Trading involves risk, and past performance is not indicative of future results.
כתב ויתור
המידע והפרסומים אינם אמורים להיות, ואינם מהווים, עצות פיננסיות, השקעות, מסחר או סוגים אחרים של עצות או המלצות שסופקו או מאושרים על ידי TradingView. קרא עוד בתנאים וההגבלות.
כתב ויתור
המידע והפרסומים אינם אמורים להיות, ואינם מהווים, עצות פיננסיות, השקעות, מסחר או סוגים אחרים של עצות או המלצות שסופקו או מאושרים על ידי TradingView. קרא עוד בתנאים וההגבלות.