🔻 NIFTY Technical Breakdown – Rising Wedge Pattern
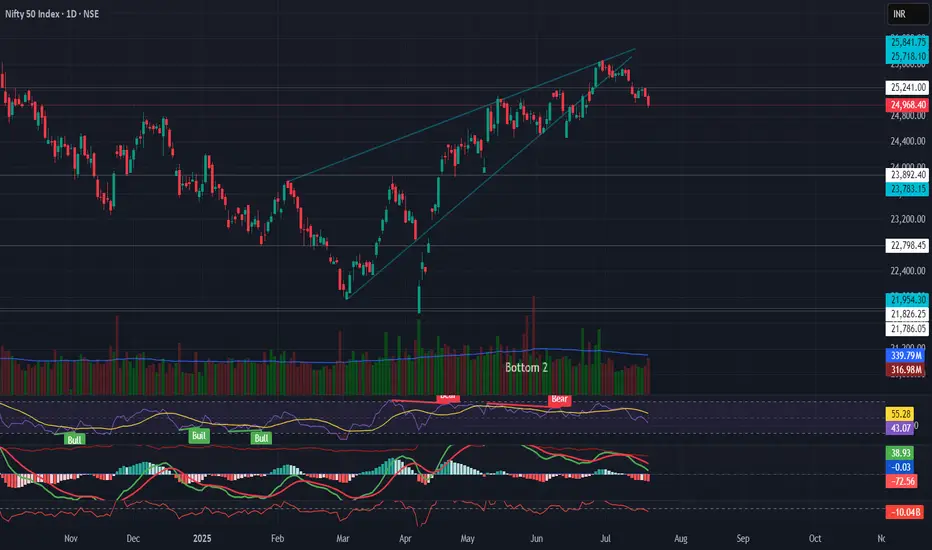
The Nifty 50 has broken down from a rising wedge pattern on the daily timeframe, a bearish reversal formation that often signals distribution at the top.
📉 Key Observations:
Rising wedge breakdown after extended rally
RSI bearish divergence confirming weakness
MACD crossover turning negative
Volume gradually decreasing during the rise, indicating exhaustion
ADX flattening, showing weakening trend strength
📌 Support Levels to Watch:
23,783 – Key swing support
22,798 – Previous breakout zone
📌 Sectoral Rotation:
Defensive sectors like Pharma & FMCG are gaining strength
FII selling pressure, rising DXY, and global uncertainty continue to weigh on sentiment
⚠️ Outlook:
Caution warranted in the short term. Watch for sustained close below 24,900 for further downside confirmation. Macro and global cues to play a key role ahead.
💬 What’s your view on Nifty's near-term direction?
#Nifty50 #TechnicalAnalysis #RisingWedge #MarketOutlook #TradingView #ChartStudy #IndiaMarkets #BearishSetup #NiftyBreakdown #Puneet0130
כתב ויתור
המידע והפרסומים אינם מיועדים להיות, ואינם מהווים, ייעוץ או המלצה פיננסית, השקעתית, מסחרית או מכל סוג אחר המסופקת או מאושרת על ידי TradingView. קרא עוד ב־תנאי השימוש.
כתב ויתור
המידע והפרסומים אינם מיועדים להיות, ואינם מהווים, ייעוץ או המלצה פיננסית, השקעתית, מסחרית או מכל סוג אחר המסופקת או מאושרת על ידי TradingView. קרא עוד ב־תנאי השימוש.