📅 NIFTY Trading Plan – 21st May 2025
🕘 Timeframe: 15-Minute | 🧠 Approach: Structure + Reaction Zones + Momentum Psychology
📊 Key Price Zones to Watch:
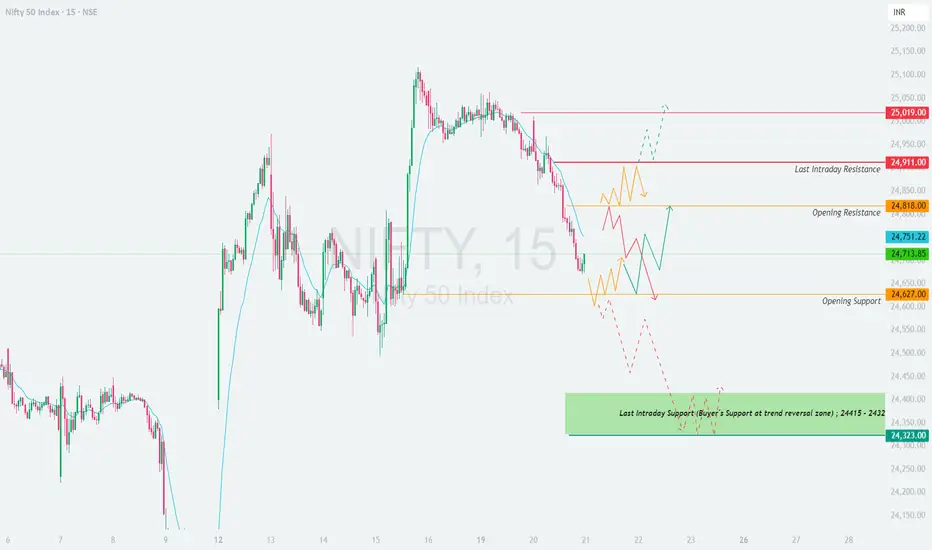
🔴 Last Intraday Resistance: 24,911
🔺 Breakout Resistance: 25,019
🟠 Opening Resistance: 24,818
🟢 Opening Support: 24,627
🟩 Buyer’s Demand Zone: 24,415 – 24,432
🧱 Critical Demand Base: 24,323
📈 Scenario 1: GAP UP Opening (🔼 100+ points) – Opening Above 24,818
If Nifty opens directly above the Opening Resistance of 24,818 due to a bullish gap-up, it enters a low-volume zone that could push prices toward 24,911 and even 25,019.
📌 Educational Note: Gap-ups often trap emotional buyers. Look for signs of sustainability before entering. If candles show exhaustion or long upper wicks, it's a red flag.
⚖️ Scenario 2: FLAT Opening (±100 points) – Between 24,627 to 24,818
A flat opening gives both bulls and bears room to maneuver, making it the most flexible condition to work with structure-based plans.
📌 Educational Note: Flat opens are all about who dominates first. Let the market decide. Don’t be early; price action is your teacher — not your ego.
📉 Scenario 3: GAP DOWN Opening (🔽 100+ points) – Opening Below 24,627
A gap-down opens doors to panic-selling but also offers opportunity if the demand zone absorbs pressure.
📌 Educational Note: Panic gaps test emotional discipline. Don't assume rebounds—wait for confirmation. It's okay to miss the first move and catch the trend later.
🛡️ Options Trading – Risk Management Tips:
✅ Avoid Far OTM Buying: Unless you see trending moves, far OTM options will decay quickly.
✅ Use Defined-Risk Spreads: Prefer Bull Call or Bear Put Spreads on breakout/breakdown confirmations.
✅ Keep SL Fixed in % Terms: Suggested: 30–40% SL of premium for option buyers.
✅ Use the Opening Candle High/Low: As SL reference for naked option positions.
✅ Avoid Overnight Carry: Especially for naked options—risk can be unlimited.
✅ Reassess After 2 Failed Trades: Market might be rangebound or volatile beyond logic.
📌 Summary & Conclusion:
🔼 Above 24,911: Momentum bullish → Target 25,019
🔄 Between 24,627 – 24,818: Neutral zone → Let structure form
🔽 Below 24,627: Weakness → Test of 24,432 → 24,323 possible
📌 Core Principle: Let the market confirm your bias. Be a sniper, not a machine gunner. Clear structure = clear edge.
📢 Disclaimer:
I am not a SEBI-registered analyst. This content is purely for educational and informational purposes[/b
🕘 Timeframe: 15-Minute | 🧠 Approach: Structure + Reaction Zones + Momentum Psychology
📊 Key Price Zones to Watch:
🔴 Last Intraday Resistance: 24,911
🔺 Breakout Resistance: 25,019
🟠 Opening Resistance: 24,818
🟢 Opening Support: 24,627
🟩 Buyer’s Demand Zone: 24,415 – 24,432
🧱 Critical Demand Base: 24,323
📈 Scenario 1: GAP UP Opening (🔼 100+ points) – Opening Above 24,818
If Nifty opens directly above the Opening Resistance of 24,818 due to a bullish gap-up, it enters a low-volume zone that could push prices toward 24,911 and even 25,019.
- []Do NOT chase long entries blindly post gap-up. First 15–30 minutes will decide the strength of bulls.
[]If a strong 15-minute candle closes above 24,911, a potential breakout to 25,019 may play out.
[]Only enter long trades if price holds above 24,911 with good volume.
[]If price faces rejection at 24,911, short-term reversal trades back to 24,818 → 24,750 are possible. - Avoid overtrading above 25,019; it’s uncharted territory and momentum may fade quickly.
📌 Educational Note: Gap-ups often trap emotional buyers. Look for signs of sustainability before entering. If candles show exhaustion or long upper wicks, it's a red flag.
⚖️ Scenario 2: FLAT Opening (±100 points) – Between 24,627 to 24,818
A flat opening gives both bulls and bears room to maneuver, making it the most flexible condition to work with structure-based plans.
- []If price sustains above 24,750–24,760 (the pivot area), buyers may push toward 24,818 → 24,911.
[]Clear bullish strength beyond 24,911 can target 25,019, but only after volume confirmation.
[]On the flip side, if price breaks below 24,627, short trades toward the Demand Zone: 24,415–24,432 become active.
[]Wait for bearish structure (e.g., breakdown + retest rejection) to confirm shorts. - Use the opening 15-minute candle high/low as your first trigger range for bias.
📌 Educational Note: Flat opens are all about who dominates first. Let the market decide. Don’t be early; price action is your teacher — not your ego.
📉 Scenario 3: GAP DOWN Opening (🔽 100+ points) – Opening Below 24,627
A gap-down opens doors to panic-selling but also offers opportunity if the demand zone absorbs pressure.
- []If price opens around 24,550–24,600 and forms a base, a bounce toward 24,627 → 24,750 is highly probable.
[]However, if price immediately slides into 24,415–24,432 (buyer zone), watch for reversal patterns like hammer, bullish engulfing, or double bottom.
[]If breakdown occurs below 24,415, then 24,323 becomes the final lifeline. A close below this may trigger sharp intraday sell-offs.
[]Only short if 15-min candle closes below 24,415 and fails retest.
📌 Educational Note: Panic gaps test emotional discipline. Don't assume rebounds—wait for confirmation. It's okay to miss the first move and catch the trend later.
🛡️ Options Trading – Risk Management Tips:
✅ Avoid Far OTM Buying: Unless you see trending moves, far OTM options will decay quickly.
✅ Use Defined-Risk Spreads: Prefer Bull Call or Bear Put Spreads on breakout/breakdown confirmations.
✅ Keep SL Fixed in % Terms: Suggested: 30–40% SL of premium for option buyers.
✅ Use the Opening Candle High/Low: As SL reference for naked option positions.
✅ Avoid Overnight Carry: Especially for naked options—risk can be unlimited.
✅ Reassess After 2 Failed Trades: Market might be rangebound or volatile beyond logic.
📌 Summary & Conclusion:
🔼 Above 24,911: Momentum bullish → Target 25,019
🔄 Between 24,627 – 24,818: Neutral zone → Let structure form
🔽 Below 24,627: Weakness → Test of 24,432 → 24,323 possible
📌 Core Principle: Let the market confirm your bias. Be a sniper, not a machine gunner. Clear structure = clear edge.
📢 Disclaimer:
I am not a SEBI-registered analyst. This content is purely for educational and informational purposes[/b
כתב ויתור
המידע והפרסומים אינם מיועדים להיות, ואינם מהווים, ייעוץ או המלצה פיננסית, השקעתית, מסחרית או מכל סוג אחר המסופקת או מאושרת על ידי TradingView. קרא עוד ב־תנאי השימוש.
כתב ויתור
המידע והפרסומים אינם מיועדים להיות, ואינם מהווים, ייעוץ או המלצה פיננסית, השקעתית, מסחרית או מכל סוג אחר המסופקת או מאושרת על ידי TradingView. קרא עוד ב־תנאי השימוש.