Key Levels (Weekly Time Frame)
Resistance Zones (Upside):
24,250 – 24,300 → Immediate supply zone / resistance
24,500 – 24,600 → Next major resistance (if breakout sustains)
24,850 – 25,000 → Psychological round level + possible profit booking
Support Zones (Downside):
23,950 – 24,000 → Immediate weekly support
23,700 – 23,750 → Strong demand zone (previous breakout level)
23,400 – 23,450 → Deeper support; trend reversal only if broken
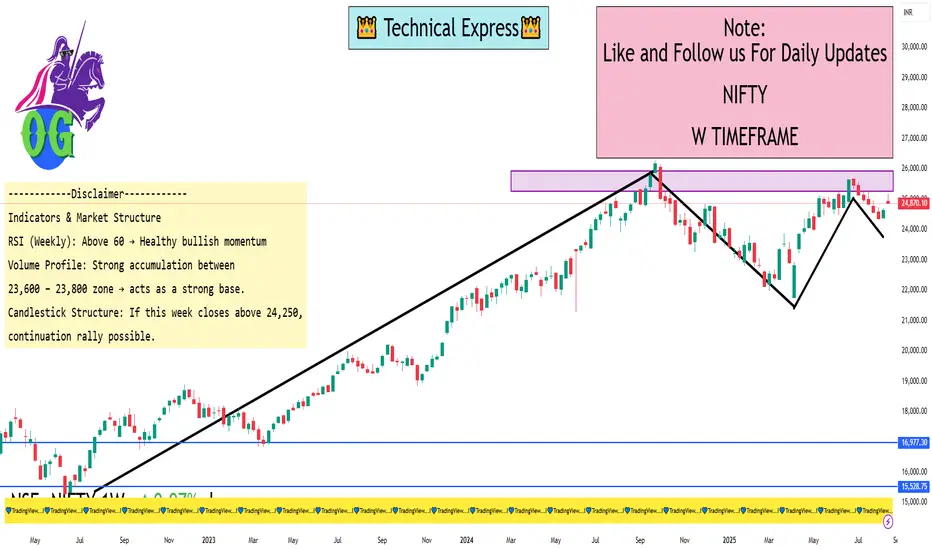
Indicators & Market Structure
RSI (Weekly): Above 60 → Healthy bullish momentum, but slightly overbought.
Volume Profile: Strong accumulation between 23,600 – 23,800 zone → acts as a strong base.
Candlestick Structure: If this week closes above 24,250, continuation rally possible. If rejection happens, sideways to mild correction.
Resistance Zones (Upside):
24,250 – 24,300 → Immediate supply zone / resistance
24,500 – 24,600 → Next major resistance (if breakout sustains)
24,850 – 25,000 → Psychological round level + possible profit booking
Support Zones (Downside):
23,950 – 24,000 → Immediate weekly support
23,700 – 23,750 → Strong demand zone (previous breakout level)
23,400 – 23,450 → Deeper support; trend reversal only if broken
Indicators & Market Structure
RSI (Weekly): Above 60 → Healthy bullish momentum, but slightly overbought.
Volume Profile: Strong accumulation between 23,600 – 23,800 zone → acts as a strong base.
Candlestick Structure: If this week closes above 24,250, continuation rally possible. If rejection happens, sideways to mild correction.
I built a Buy & Sell Signal Indicator with 85% accuracy.
📈 Get access via DM or
WhatsApp: wa.link/d997q0
Contact - +91 76782 40962
| Email: techncialexpress@gmail.com
| Script Coder | Trader | Investor | From India
📈 Get access via DM or
WhatsApp: wa.link/d997q0
Contact - +91 76782 40962
| Email: techncialexpress@gmail.com
| Script Coder | Trader | Investor | From India
פרסומים קשורים
כתב ויתור
המידע והפרסומים אינם מיועדים להיות, ואינם מהווים, ייעוץ או המלצה פיננסית, השקעתית, מסחרית או מכל סוג אחר המסופקת או מאושרת על ידי TradingView. קרא עוד ב־תנאי השימוש.