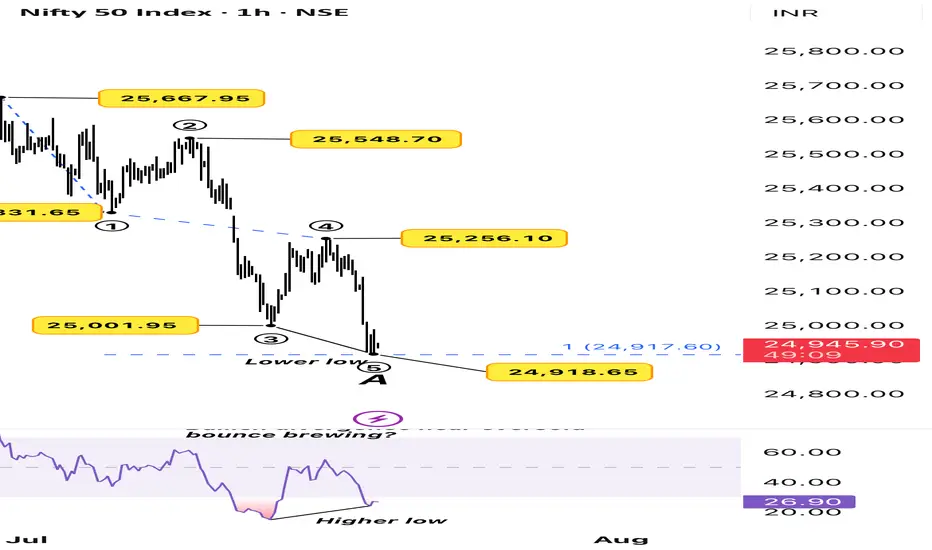
The Nifty 50 has completed a 5-wave impulse on the 1-hour timeframe, with Wave ⑤ tagging a fresh lower low at 24,918, just under the previous swing.
While price made a lower low, RSI made a higher low, forming a bullish divergence just above the oversold zone. This often indicates weakening bearish momentum and a potential for a short-term bounce or a larger correction depending on the context.
We now have:
• ✅ A completed 5-wave(wave A) decline
• ✅ Price at a key support zone
• ✅ RSI divergence adding confluence
If this structure holds, we may have completed wave A and be entering Wave B of correction.
Disclaimer: This analysis is for educational purposes only and does not constitute investment advice. Please do your own research (DYOR) before making any trading decisions.
WaveXplorer | Elliott Wave insights
📊 X profile: @veerappa89
📊 X profile: @veerappa89
כתב ויתור
המידע והפרסומים אינם מיועדים להיות, ואינם מהווים, ייעוץ או המלצה פיננסית, השקעתית, מסחרית או מכל סוג אחר המסופקת או מאושרת על ידי TradingView. קרא עוד ב־תנאי השימוש.
WaveXplorer | Elliott Wave insights
📊 X profile: @veerappa89
📊 X profile: @veerappa89
כתב ויתור
המידע והפרסומים אינם מיועדים להיות, ואינם מהווים, ייעוץ או המלצה פיננסית, השקעתית, מסחרית או מכל סוג אחר המסופקת או מאושרת על ידי TradingView. קרא עוד ב־תנאי השימוש.