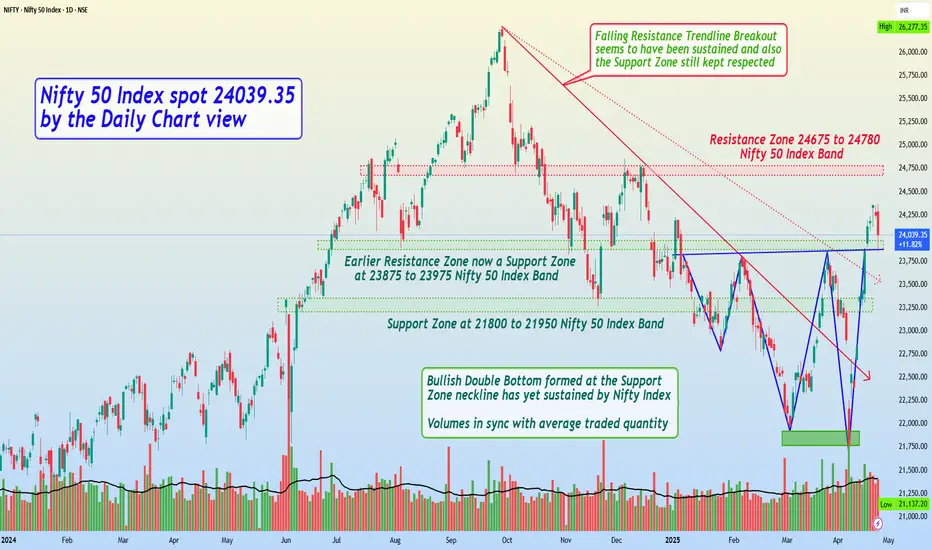
Nifty 50 Index spot 24039.35 by the Daily Chart view - Weekly Update
- Resistance Zone 24675 to 24780 Nifty 50 Index Band
- Volumes are in good sync with the average traded quantity
- Both the Falling Resistance Trendlines have been decently maintained todate
- Earlier Resistance Zone now a Support Zone at 23875 to 23975 Nifty 50 Index Band
- Bullish Double Bottom formed at the Support Zone neckline has yet sustained by Nifty Index
פרסומים קשורים
כתב ויתור
המידע והפרסומים אינם מיועדים להיות, ואינם מהווים, ייעוץ או המלצה פיננסית, השקעתית, מסחרית או מכל סוג אחר המסופקת או מאושרת על ידי TradingView. קרא עוד ב־תנאי השימוש.
פרסומים קשורים
כתב ויתור
המידע והפרסומים אינם מיועדים להיות, ואינם מהווים, ייעוץ או המלצה פיננסית, השקעתית, מסחרית או מכל סוג אחר המסופקת או מאושרת על ידי TradingView. קרא עוד ב־תנאי השימוש.