# 📊 NIFTY50 Daily Chart Analysis: Bearish Engulfing Pattern
## 🔍 Pattern Identification
**Bearish Engulfing Pattern** spotted on NIFTY50 daily chart - but let's dive deeper into the probability matrix!
## 📈 Statistical Edge
- **Standard Success Rate**: 70-72% with proper volume/RSI confirmation
- **Current Scenario**: Reduced to **60-65%** due to:
- ❌ Missing volume confirmation
- 📊 Sideways trend (25,000-25,150 range)
## 🎯 Key Technical Observations
### Volume Profile Analysis
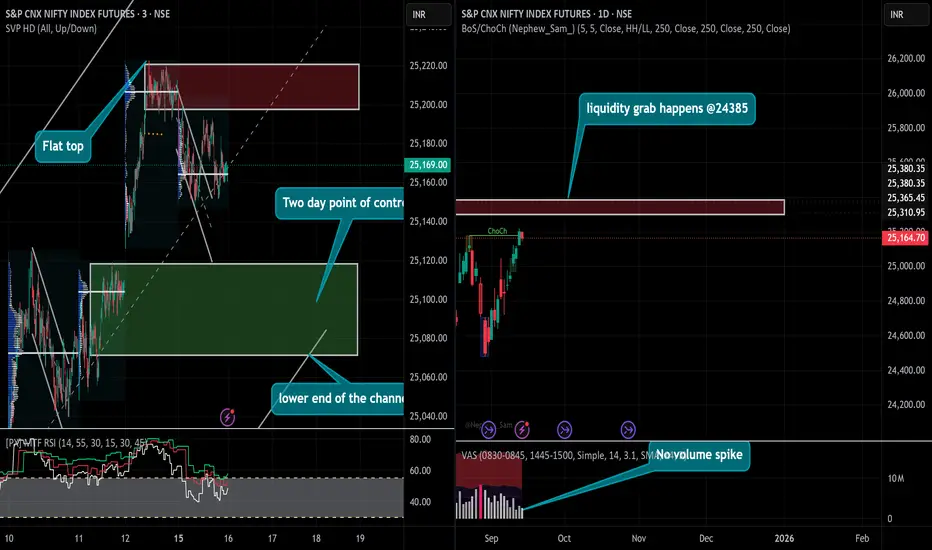
- **Flat top** formation observed
- **No profit-taking volume spike** = Pattern appears incomplete
- Volume confirmation missing for bearish follow-through
### Critical Support/Resistance Zones
- **2-Day POC Control Zone**: 25,070-25,100
- **Current Position**: Lower end of uptrending channel
- **Range-bound action**: 25,000-25,150
## 🟢 The Bullish Case
**Why bears might struggle here:**
- Trading at channel support
- Volume profile suggests incomplete distribution
- POC control zone acting as strong support
## 💡 Trading Strategy
**Green Zone Buying Opportunity**: 25,070-25,100
- ⚠️ **Expiry Day Caution**: Reduced position sizing recommended
- 🎯 Risk/Reward favors buyers at these levels
- 📊 Channel support provides structural backing
## 🔔 Risk Management
- Given expiry volatility, manage position size carefully
- Watch for volume confirmation on any directional move
- Key level to watch: Break of 25,070 could accelerate downside
**#NIFTY50 #TechnicalAnalysis #BearishEngulfing #VolumeProfile #TradingStrategy #ExpiryDay**
## 🔍 Pattern Identification
**Bearish Engulfing Pattern** spotted on NIFTY50 daily chart - but let's dive deeper into the probability matrix!
## 📈 Statistical Edge
- **Standard Success Rate**: 70-72% with proper volume/RSI confirmation
- **Current Scenario**: Reduced to **60-65%** due to:
- ❌ Missing volume confirmation
- 📊 Sideways trend (25,000-25,150 range)
## 🎯 Key Technical Observations
### Volume Profile Analysis
- **Flat top** formation observed
- **No profit-taking volume spike** = Pattern appears incomplete
- Volume confirmation missing for bearish follow-through
### Critical Support/Resistance Zones
- **2-Day POC Control Zone**: 25,070-25,100
- **Current Position**: Lower end of uptrending channel
- **Range-bound action**: 25,000-25,150
## 🟢 The Bullish Case
**Why bears might struggle here:**
- Trading at channel support
- Volume profile suggests incomplete distribution
- POC control zone acting as strong support
## 💡 Trading Strategy
**Green Zone Buying Opportunity**: 25,070-25,100
- ⚠️ **Expiry Day Caution**: Reduced position sizing recommended
- 🎯 Risk/Reward favors buyers at these levels
- 📊 Channel support provides structural backing
## 🔔 Risk Management
- Given expiry volatility, manage position size carefully
- Watch for volume confirmation on any directional move
- Key level to watch: Break of 25,070 could accelerate downside
**#NIFTY50 #TechnicalAnalysis #BearishEngulfing #VolumeProfile #TradingStrategy #ExpiryDay**
כתב ויתור
המידע והפרסומים אינם אמורים להיות, ואינם מהווים, עצות פיננסיות, השקעות, מסחר או סוגים אחרים של עצות או המלצות שסופקו או מאושרים על ידי TradingView. קרא עוד בתנאים וההגבלות.
כתב ויתור
המידע והפרסומים אינם אמורים להיות, ואינם מהווים, עצות פיננסיות, השקעות, מסחר או סוגים אחרים של עצות או המלצות שסופקו או מאושרים על ידי TradingView. קרא עוד בתנאים וההגבלות.