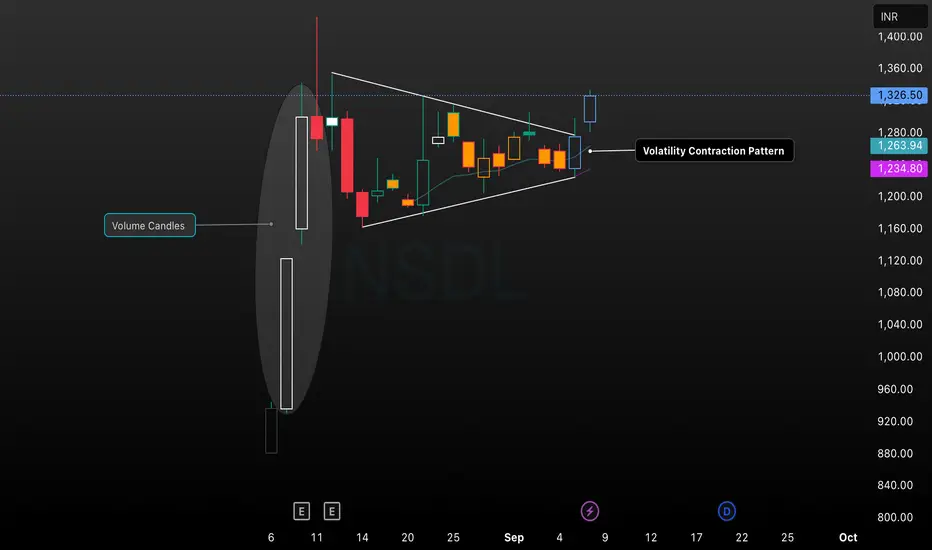
This chart displays the NSDL stock price on a daily timeframe, featuring a classic Volatility Contraction Pattern (VCP) after a surge in volume and price. The consolidation phase is marked by converging trendlines, with price contracting and forming tighter ranges. The recent breakout above the upper trendline signals renewed bullish momentum. Volume candles accentuate the initial surge, and key support/resistance levels are noted. This technical setup is ideal for traders seeking entries based on volatility contraction and breakout strategies.
כתב ויתור
המידע והפרסומים אינם אמורים להיות, ואינם מהווים, עצות פיננסיות, השקעות, מסחר או סוגים אחרים של עצות או המלצות שסופקו או מאושרים על ידי TradingView. קרא עוד בתנאים וההגבלות.
כתב ויתור
המידע והפרסומים אינם אמורים להיות, ואינם מהווים, עצות פיננסיות, השקעות, מסחר או סוגים אחרים של עצות או המלצות שסופקו או מאושרים על ידי TradingView. קרא עוד בתנאים וההגבלות.