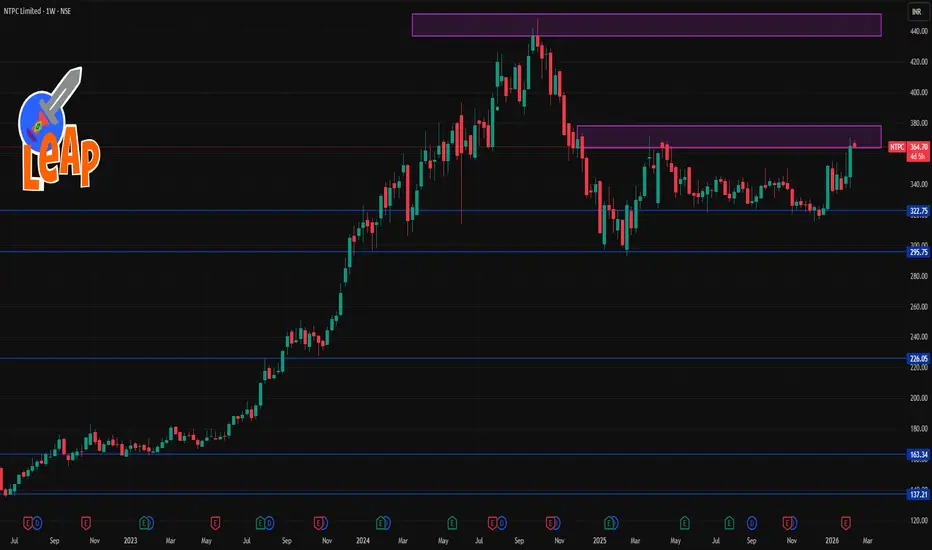
📊 Current Approx Price Range
• Trading near ₹365–₹370 on the NSE this week.
📈 Weekly Resistance Levels (Upside)
• R1: ~₹378 – first reaction resistance this week
• R2: ~₹390 – secondary hurdle before fresh upside
• R3: ~₹410 – extended resistance if bulls dominate
• Fibonacci/Weekly Pivot R2–R3: ~₹390–₹411 area
📉 Weekly Support Levels (Downside)
• S1: ~₹345 – first major weekly support zone
• S2: ~₹325 – deeper support if S1 breaks
• S3: ~₹312 – last weekly structure support
• Weekly Pivot/Fib S1 area: ~₹324–₹345
📌 Weekly Pivot Approx Levels (from pivot calculations)
• Standard weekly pivots place pivot ~₹357–₹358, with support/resistance branching around it.
📊 Technical Signals (Weekly)
• Some platforms show a bullish/“strong buy” bias based on weekly indicators (moving averages & oscillators) — suggesting the trend is currently positive if the price holds above key supports.
Quick summary:
➡️ Bullish week if NTPC holds above ₹345 and breaks above ₹378–₹390.
➡️ Bearish pressure if weekly close slips below ₹345 → ₹325 → ₹312.
פרסומים קשורים
כתב ויתור
המידע והפרסומים אינם מיועדים להיות, ואינם מהווים, ייעוץ או המלצה פיננסית, השקעתית, מסחרית או מכל סוג אחר המסופקת או מאושרת על ידי TradingView. קרא עוד ב־תנאי השימוש.
פרסומים קשורים
כתב ויתור
המידע והפרסומים אינם מיועדים להיות, ואינם מהווים, ייעוץ או המלצה פיננסית, השקעתית, מסחרית או מכל סוג אחר המסופקת או מאושרת על ידי TradingView. קרא עוד ב־תנאי השימוש.