⚡ NTPC Limited (NSE: NTPC) – 1H Chart Analysis
🧠 Market Structure
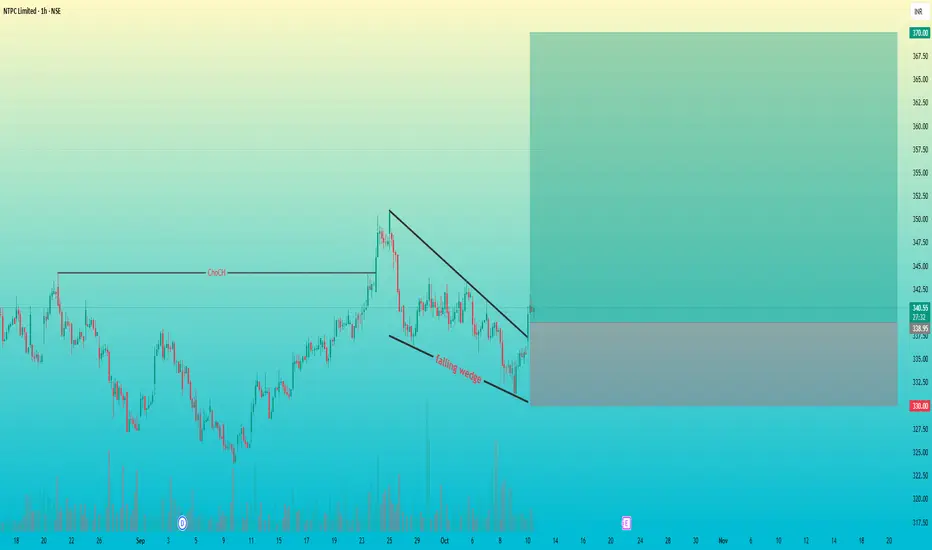
After a strong impulsive move up, the price created a Change of Character (ChoCH) — signaling a shift from bearish to bullish market structure.
Post-ChoCH, price entered a falling wedge corrective pattern — a typical bullish continuation signal.
The wedge breakout indicates a possible resumption of the prior bullish trend.
🔍 Pattern Insight
Pattern: Falling Wedge (Bullish)
Timeframe: 1 Hour
Confirmation: Breakout above wedge resistance
Structure Bias: Bullish continuation
🎯 Trade Plan
Entry: Current Market Price
Stop Loss: ₹330 (below wedge low).
Target: ₹370 (projected from wedge height).
Risk–Reward Ratio: ~1:3
⚙️ Confluences
✅ Falling wedge breakout near ChoCH zone → confirms structural shift
✅ Clear liquidity grab below wedge before breakout (smart money entry)
🧠 Market Structure
After a strong impulsive move up, the price created a Change of Character (ChoCH) — signaling a shift from bearish to bullish market structure.
Post-ChoCH, price entered a falling wedge corrective pattern — a typical bullish continuation signal.
The wedge breakout indicates a possible resumption of the prior bullish trend.
🔍 Pattern Insight
Pattern: Falling Wedge (Bullish)
Timeframe: 1 Hour
Confirmation: Breakout above wedge resistance
Structure Bias: Bullish continuation
🎯 Trade Plan
Entry: Current Market Price
Stop Loss: ₹330 (below wedge low).
Target: ₹370 (projected from wedge height).
Risk–Reward Ratio: ~1:3
⚙️ Confluences
✅ Falling wedge breakout near ChoCH zone → confirms structural shift
✅ Clear liquidity grab below wedge before breakout (smart money entry)
עסקה פעילה
כתב ויתור
המידע והפרסומים אינם מיועדים להיות, ואינם מהווים, ייעוץ או המלצה פיננסית, השקעתית, מסחרית או מכל סוג אחר המסופקת או מאושרת על ידי TradingView. קרא עוד ב־תנאי השימוש.
כתב ויתור
המידע והפרסומים אינם מיועדים להיות, ואינם מהווים, ייעוץ או המלצה פיננסית, השקעתית, מסחרית או מכל סוג אחר המסופקת או מאושרת על ידי TradingView. קרא עוד ב־תנאי השימוש.