Steps to Trade the Double Bottom PatternIdentify the Pattern
Look for a downtrend in the price chart.
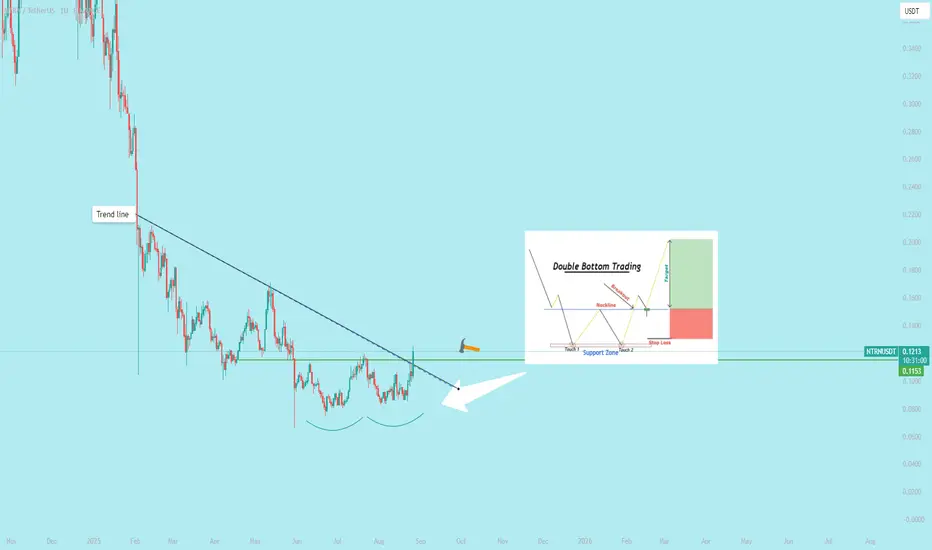
Spot two lows (bottoms) at approximately the same price level, forming a support zone. These lows should be separated by a peak (the middle of the "W").
The pattern is more reliable on higher timeframes (e.g., daily or 4-hour charts).
Confirm the Pattern:Ensure the two bottoms are well-defined and not too far apart in time.
Check for increased volume on the second bottom or during the breakout, as it supports the pattern's validity.
Use additional indicators like RSI or MACD to confirm bullish momentum (e.g., RSI showing oversold conditions or a bullish divergence).
Define Key Levels:Support: The price level of the two bottoms.
Neckline: The horizontal line connecting the high point between the two bottoms (the peak of the "W").
Target: Measure the vertical distance from the bottoms to the neckline and project it upward from the breakout point for a potential price target.
Entry Point:Enter a long (buy) position when the price breaks above the neckline with strong momentum (e.g., a strong bullish candle or increased volume).
Alternatively, wait for a retest of the neckline (now acting as support) after the breakout to confirm the move.
Set Stop-Loss:Place a stop-loss just below the second bottom to protect against false breakouts.
A tighter stop-loss can be placed below the neckline if you're entering on a retest, but ensure it accounts for market volatility.
Set Profit Target:Use the height of the pattern (distance from bottoms to neckline) to estimate the target. For example, if the distance is $10, the target is $10 above the neckline.
Alternatively, trail your stop-loss or use resistance levels to lock in profits.
Manage the Trade:Monitor volume and momentum during the breakout. Weak volume may indicate a false breakout.
Adjust your stop-loss to breakeven once the price moves significantly in your favor.
Be cautious of news or events that could invalidate the pattern.
ExampleStock/Forex/Crypto: Price drops to $50 (first bottom), rises to $55 (neckline), drops back to $50 (second bottom), then breaks above $55.
Entry: Buy at $55.50 (breakout confirmation).
Stop-Loss: $49.50 (below the second bottom).
Target: $60 (neckline $55 + pattern height $5).
Risk-Reward Ratio: Calculate to ensure at least 1:2 (risk $1 to gain $2).
Look for a downtrend in the price chart.
Spot two lows (bottoms) at approximately the same price level, forming a support zone. These lows should be separated by a peak (the middle of the "W").
The pattern is more reliable on higher timeframes (e.g., daily or 4-hour charts).
Confirm the Pattern:Ensure the two bottoms are well-defined and not too far apart in time.
Check for increased volume on the second bottom or during the breakout, as it supports the pattern's validity.
Use additional indicators like RSI or MACD to confirm bullish momentum (e.g., RSI showing oversold conditions or a bullish divergence).
Define Key Levels:Support: The price level of the two bottoms.
Neckline: The horizontal line connecting the high point between the two bottoms (the peak of the "W").
Target: Measure the vertical distance from the bottoms to the neckline and project it upward from the breakout point for a potential price target.
Entry Point:Enter a long (buy) position when the price breaks above the neckline with strong momentum (e.g., a strong bullish candle or increased volume).
Alternatively, wait for a retest of the neckline (now acting as support) after the breakout to confirm the move.
Set Stop-Loss:Place a stop-loss just below the second bottom to protect against false breakouts.
A tighter stop-loss can be placed below the neckline if you're entering on a retest, but ensure it accounts for market volatility.
Set Profit Target:Use the height of the pattern (distance from bottoms to neckline) to estimate the target. For example, if the distance is $10, the target is $10 above the neckline.
Alternatively, trail your stop-loss or use resistance levels to lock in profits.
Manage the Trade:Monitor volume and momentum during the breakout. Weak volume may indicate a false breakout.
Adjust your stop-loss to breakeven once the price moves significantly in your favor.
Be cautious of news or events that could invalidate the pattern.
ExampleStock/Forex/Crypto: Price drops to $50 (first bottom), rises to $55 (neckline), drops back to $50 (second bottom), then breaks above $55.
Entry: Buy at $55.50 (breakout confirmation).
Stop-Loss: $49.50 (below the second bottom).
Target: $60 (neckline $55 + pattern height $5).
Risk-Reward Ratio: Calculate to ensure at least 1:2 (risk $1 to gain $2).
כתב ויתור
המידע והפרסומים אינם מיועדים להיות, ואינם מהווים, ייעוץ או המלצה פיננסית, השקעתית, מסחרית או מכל סוג אחר המסופקת או מאושרת על ידי TradingView. קרא עוד ב־תנאי השימוש.
כתב ויתור
המידע והפרסומים אינם מיועדים להיות, ואינם מהווים, ייעוץ או המלצה פיננסית, השקעתית, מסחרית או מכל סוג אחר המסופקת או מאושרת על ידי TradingView. קרא עוד ב־תנאי השימוש.