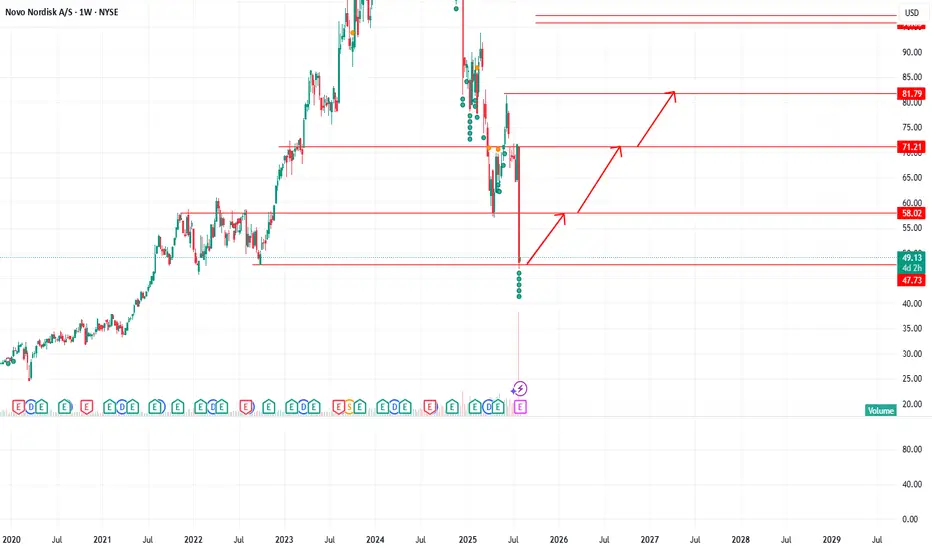
Novo Nordisk (NVO) recently saw a sharp drop with heavy volume, signaling strong selling pressure. The chart shows a potential recovery path if the stock holds support near $47.
🔄 Possible rebound levels:
First target: $58
Mid target: $71
Final target: $82
📊 Options flow shows strong call activity (bullish bets), with a low put/call ratio, suggesting some traders expect a bounce. However, momentum is still weak, and if $47 fails, further downside toward $36 or lower is possible.
כתב ויתור
המידע והפרסומים אינם מיועדים להיות, ואינם מהווים, ייעוץ או המלצה פיננסית, השקעתית, מסחרית או מכל סוג אחר המסופקת או מאושרת על ידי TradingView. קרא עוד ב־תנאי השימוש.
כתב ויתור
המידע והפרסומים אינם מיועדים להיות, ואינם מהווים, ייעוץ או המלצה פיננסית, השקעתית, מסחרית או מכל סוג אחר המסופקת או מאושרת על ידי TradingView. קרא עוד ב־תנאי השימוש.