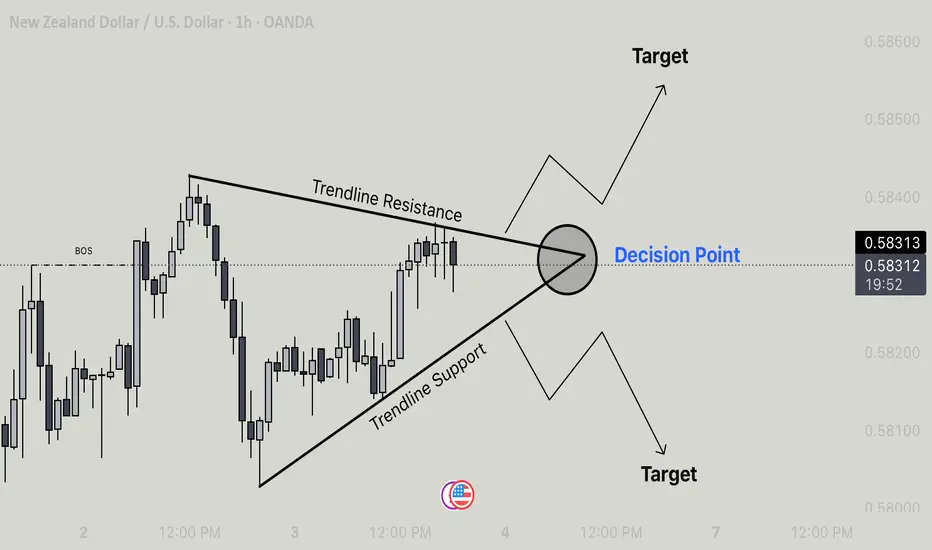
The price is consolidating inside a symmetrical triangle pattern formed by:
• Trendline Resistance (upper line)
• Trendline Support (lower line)
• The apex (where the two lines converge) is marked as the Decision Point. This is where price is likely to break out, either upward or downward.
Key Observations
1. Break of Structure (BOS):
• A previous structural break is marked on the chart, showing where the price had shifted momentum earlier.
2. Decision Point:
• Price is currently trading near 0.58292.
• At this point, a breakout could happen in either direction (up or down).
3. Targets:
• Upside Target: Near 0.58600 (if price breaks above the resistance).
• Downside Target: Near 0.58000 (if price breaks below the support).
Trading Implications
• Bullish Scenario: If price breaks and closes above the trendline resistance, buyers could push towards the 0.58600 level.
• Bearish Scenario: If price breaks and closes below the trendline support, sellers may drive it down to 0.58000.
• Neutral Zone: Until breakout confirmation, price may continue to consolidate inside the triangle.
Summary:
The market is at a decision point. Traders should watch for a confirmed breakout above resistance (for longs) or below support (for shorts) before entering trades.
כתב ויתור
המידע והפרסומים אינם אמורים להיות, ואינם מהווים, עצות פיננסיות, השקעות, מסחר או סוגים אחרים של עצות או המלצות שסופקו או מאושרים על ידי TradingView. קרא עוד בתנאים וההגבלות.
כתב ויתור
המידע והפרסומים אינם אמורים להיות, ואינם מהווים, עצות פיננסיות, השקעות, מסחר או סוגים אחרים של עצות או המלצות שסופקו או מאושרים על ידי TradingView. קרא עוד בתנאים וההגבלות.