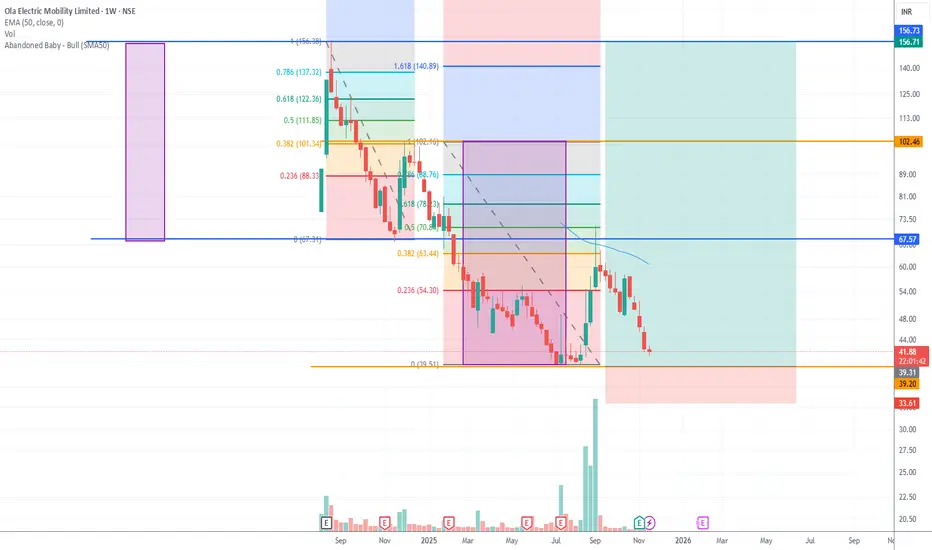
Price Zone of Interest: ₹39–₹41
Stop-Loss (Weekly Close Basis): ₹34
Timeframe: Weekly
Bias: Potential Long Setup (High Risk, Technically Driven)
Entry / SL / Targets
🟢 Entry Zone (Accumulation Zone):
✔ ₹39–₹41
🔴 Stop-Loss (Strict Weekly Close):
✔ ₹34
Below this, the double-bottom pattern fails.
🎯 Potential Upside Targets:
T1: ₹54
T2: ₹63–64
T3: ₹70
T4: ₹78
Upside targets depend on weekly momentum and volume confirmation.
------------------------------
Key Technical Observations
1. Double Bottom Structure Forming
Price has returned to the strong demand zone around ₹39–₹41, which previously acted as a key swing low.
A double bottom is possible if the stock holds this level on a weekly closing basis.
A confirmed weekly reversal candle here increases the probability of a bounce.
------------------------------
Fibonacci Behavior (Weekly) – Pattern Repeating
When applying Fibonacci retracements on the previous weekly downswings:
1st Downtrend Retracement: Price reversed at the 0.382 level
2nd Downtrend Retracement: Price reversed at the 0.50 level
This shows that the stock has been respecting mid-Fibonacci retracements during corrective moves.
If a bounce starts from the same zone again, the next fib levels act as natural upside targets.
כתב ויתור
המידע והפרסומים אינם מיועדים להיות, ואינם מהווים, ייעוץ או המלצה פיננסית, השקעתית, מסחרית או מכל סוג אחר המסופקת או מאושרת על ידי TradingView. קרא עוד ב־תנאי השימוש.
כתב ויתור
המידע והפרסומים אינם מיועדים להיות, ואינם מהווים, ייעוץ או המלצה פיננסית, השקעתית, מסחרית או מכל סוג אחר המסופקת או מאושרת על ידי TradingView. קרא עוד ב־תנאי השימוש.