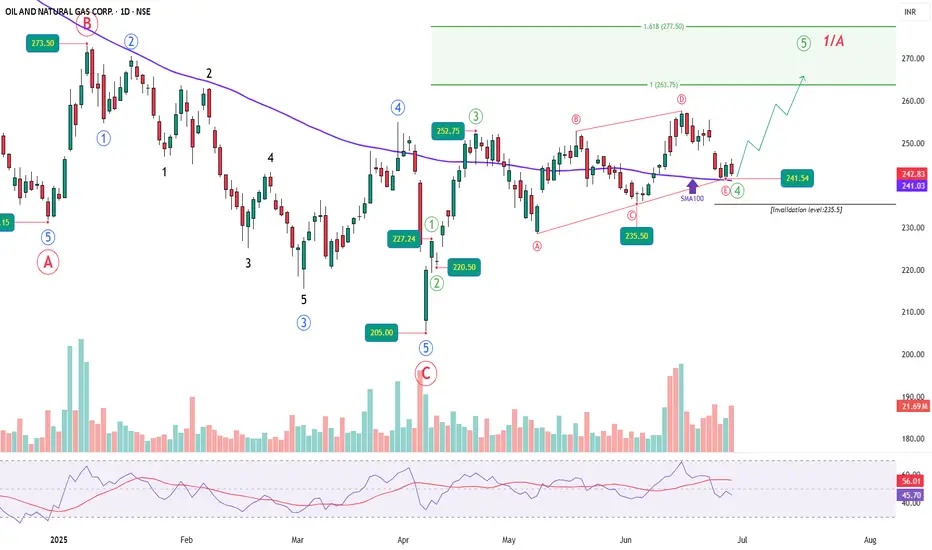
Following the completion of Wave 3 — an impulsive rally from the 205 low — ONGC entered what looks like a classic Wave 4 triangle. The internal structure — labeled A through E — unfolded in a controlled, converging fashion, respecting the triangle boundaries. Wave E recently ended near 241.54, right on top of the 100-day simple moving average, which has acted as dynamic support.
Interestingly, we saw strong volume come in during the rally into Wave D, indicating buying interest. This was followed by a period of low volume and sideways drift during Wave E, which fits the expected behavior for the final leg of a triangle. RSI also cooled off during this period, resetting from overbought levels, and currently hovers just below the 50 mark.
The invalidation for this triangle setup is placed below the Wave C low, around 235.5. A decisive break below this level would nullify the triangle structure and open the door for a deeper, more complex correction. But as long as price respects this zone and begins to push upward with volume, the case for a Wave 5 rally remains strong.
Fibonacci projections place the 100% extension of Wave 1 through 3 near 263.75 and the 1.618 extension near 277.50 — a likely zone for Wave 5 termination. If ONGC can break above the D-wave high with momentum, it may very well be headed toward those levels in the coming weeks.
WaveXplorer | Elliott Wave insights
📊 X profile: @veerappa89
📊 X profile: @veerappa89
כתב ויתור
המידע והפרסומים אינם מיועדים להיות, ואינם מהווים, ייעוץ או המלצה פיננסית, השקעתית, מסחרית או מכל סוג אחר המסופקת או מאושרת על ידי TradingView. קרא עוד ב־תנאי השימוש.
WaveXplorer | Elliott Wave insights
📊 X profile: @veerappa89
📊 X profile: @veerappa89
כתב ויתור
המידע והפרסומים אינם מיועדים להיות, ואינם מהווים, ייעוץ או המלצה פיננסית, השקעתית, מסחרית או מכל סוג אחר המסופקת או מאושרת על ידי TradingView. קרא עוד ב־תנאי השימוש.