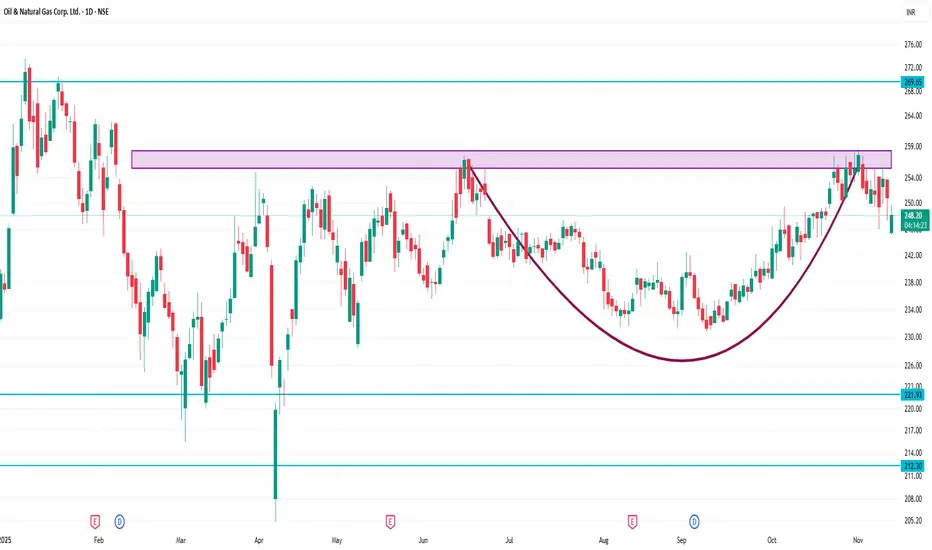
🎯 Key levels to watch on the 1-day chart
Support zone: ~ ₹ 245-243 region (falls in line with support zones and moving average base)
Near support: ~ ₹ 248-250 (if price returns toward pivot/support)
Resistance zone: ~ ₹ 253-257 region (prior resistance, pivot R1, chart resistance).
If ONGC breaks above ~₹ 257 with conviction, next higher resistance might be ~ ₹ 260+ (depending on trend).
If ONGC breaks down below ~₹ 243 (support zone) with volume, possible further drop toward ~₹ 241 or ~₹ 225 in longer term.
פרסומים קשורים
כתב ויתור
המידע והפרסומים אינם מיועדים להיות, ואינם מהווים, ייעוץ או המלצה פיננסית, השקעתית, מסחרית או מכל סוג אחר המסופקת או מאושרת על ידי TradingView. קרא עוד ב־תנאי השימוש.
פרסומים קשורים
כתב ויתור
המידע והפרסומים אינם מיועדים להיות, ואינם מהווים, ייעוץ או המלצה פיננסית, השקעתית, מסחרית או מכל סוג אחר המסופקת או מאושרת על ידי TradingView. קרא עוד ב־תנאי השימוש.