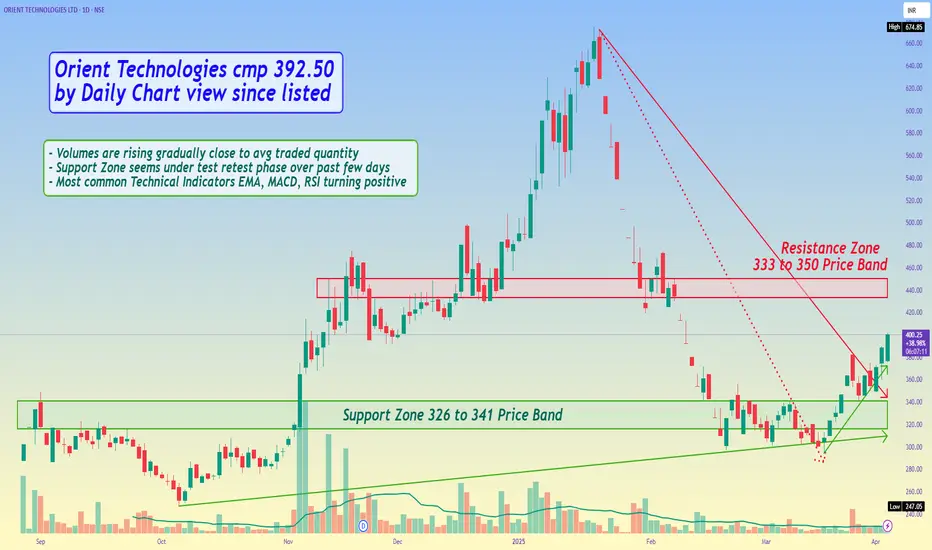
Orient Technologies cmp 392.50 by Daily Chart view since listed
- Support Zone 326 to 341 Price Band
- Resistance Zone 333 to 350 Price Band
- Volumes are rising gradually close to avg traded quantity
- Support Zone seems under test retest phase over past few days
- Most common Technical Indicators EMA, MACD, RSI turning positive
- Price sustaining above Falling Resistance Trendline and Rising Support Trendline
הערה
Ooops My Bad.... Please read the Resistance Zone as 433 to 450 Price Band כתב ויתור
המידע והפרסומים אינם מיועדים להיות, ואינם מהווים, ייעוץ או המלצה פיננסית, השקעתית, מסחרית או מכל סוג אחר המסופקת או מאושרת על ידי TradingView. קרא עוד ב־תנאי השימוש.
כתב ויתור
המידע והפרסומים אינם מיועדים להיות, ואינם מהווים, ייעוץ או המלצה פיננסית, השקעתית, מסחרית או מכל סוג אחר המסופקת או מאושרת על ידי TradingView. קרא עוד ב־תנאי השימוש.