🟡 Chart Structure
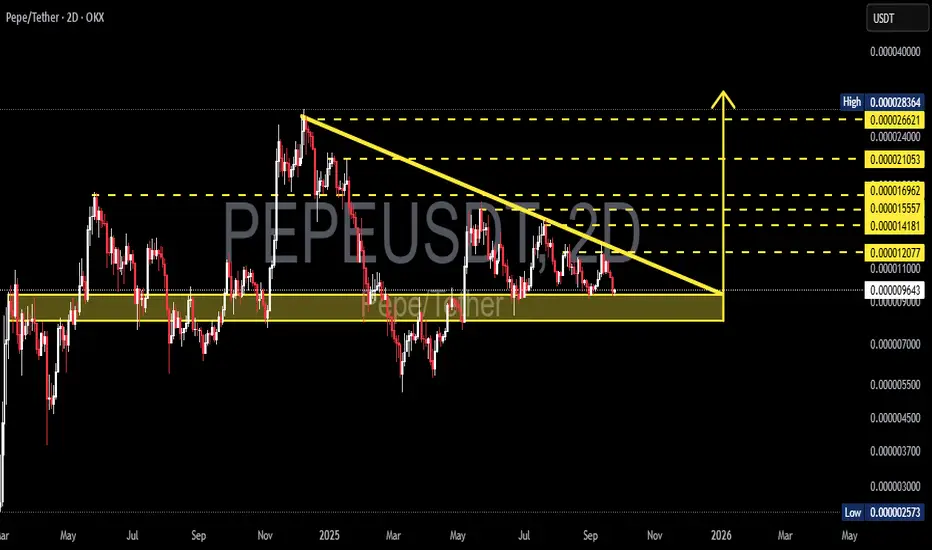
PEPE is currently in a critical phase. The price has been forming a descending triangle (lower highs + horizontal support) for several months.
Current price: 0.000009638
Major Support Zone: 0.000007000 – 0.000011100 (yellow box)
Key Downtrend Resistance: descending yellow trendline from 2025 highs
Upside Levels: 0.000012077 → 0.000014181 → 0.000015557 → 0.000016962 → 0.000021053 → 0.000024000 → 0.000026621
Extreme Low: 0.000002573
---
🟢 Bullish Scenario — The Big Breakout
If PEPE breaks above the downtrend line and closes above 0.000012077 with strong volume, then:
1. The descending triangle breakout will be confirmed.
2. Measured Move Target:
Pattern height = (High 0.000028364 − Support 0.000009638) = 0.000018726
Added to breakout level (0.000012077 + 0.000018726) = 0.000030803
Potential upside: +220% from current levels.
3. Likely progression step by step:
Short-term resistance: 0.000014 – 0.000017
Next milestones: 0.000021 – 0.000024 → 0.000026+ toward the final target.
4. If confirmed, this could be one of the strongest rallies of the year for PEPE.
---
🔴 Bearish Scenario — Breakdown Risk
Statistically, descending triangles tend to lean bearish. If the yellow support zone (0.000007000 – 0.000009000) breaks with volume, then:
1. The structure fails and selling pressure accelerates.
2. Downside targets:
0.000005000 → 0.000003000 → extreme low at 0.000002573.
3. From current price to 0.000002573 = -73% downside risk.
4. Failure to hold support could trigger a sharp continuation of the bearish trend.
---
📐 Technical Pattern — Descending Triangle
Meaning: sellers keep pushing lower highs, while buyers defend one horizontal area.
Bias: bearish continuation by default.
But… if bulls break the trendline, it flips into a powerful bullish reversal signal → often followed by rapid rallies.
---
🧠 Key Notes for Traders
Don’t enter trades just because price touches support or resistance → always wait for a 2D candle close + volume confirmation.
Breakout: avoid FOMO, wait for a retest of the breakout area for a safer entry.
Breakdown: avoid holding longs → prepare for deeper support tests.
Risk management is crucial: use stop-loss and proper position sizing.
---
✨ Conclusion
PEPE is at a major crossroads:
Breakout → upside potential to 0.000030803 (+220%).
Breakdown → downside risk to the historical low around 0.000002573 (−73%).
This is not just sideways consolidation — it’s a decision zone that could define PEPE’s next big move for the months ahead. Traders should be prepared for both scenarios with strict discipline.
---
#PEPE #PEPEUSDT #Crypto #Altcoins #TechnicalAnalysis #Breakout #SupportResistance #DescendingTriangle #CryptoTrading
✅ Get Free Signals! Join Our Telegram Channel Here: t.me/TheCryptoNuclear
✅ Twitter: twitter.com/crypto_nuclear
✅ Join Bybit : partner.bybit.com/b/nuclearvip
✅ Benefits : Lifetime Trading Fee Discount -50%
✅ Twitter: twitter.com/crypto_nuclear
✅ Join Bybit : partner.bybit.com/b/nuclearvip
✅ Benefits : Lifetime Trading Fee Discount -50%
כתב ויתור
המידע והפרסומים אינם אמורים להיות, ואינם מהווים, עצות פיננסיות, השקעות, מסחר או סוגים אחרים של עצות או המלצות שסופקו או מאושרים על ידי TradingView. קרא עוד בתנאים וההגבלות.