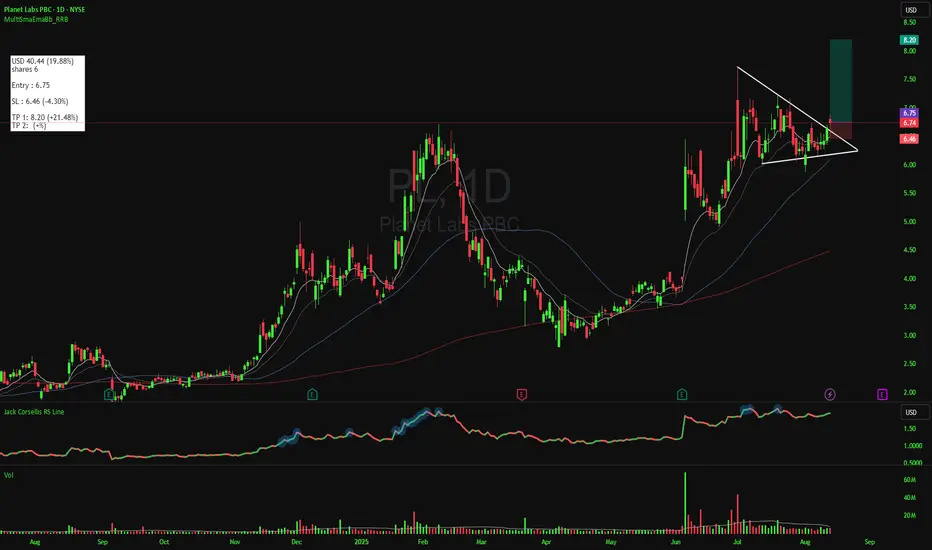
There is also a breakout from Bullish Pennant Pattern, but did not occur on a green candle, which raises concern about whether this is a valid breakout.Still, it's worth keeping an eye on.
Futhermore, the stock is making new highs, as shown by the indicator below (Jack Corsellis RS Line), where a blue light appears when the stock reaches a new high.
Moreover, volume was very low while the price was forming the pattern, which is what we want. The next step is we need to see a breakout with a solid green candle and supported by large volume exceeding the 30-day moving average.
Lastly, earnings per Share (EPS) have shown a recovery from the last quarter, improving from -0.12 in 2025/Q4 to -0.04 in 2026/Q1.
כתב ויתור
המידע והפרסומים אינם מיועדים להיות, ואינם מהווים, ייעוץ או המלצה פיננסית, השקעתית, מסחרית או מכל סוג אחר המסופקת או מאושרת על ידי TradingView. קרא עוד ב־תנאי השימוש.
כתב ויתור
המידע והפרסומים אינם מיועדים להיות, ואינם מהווים, ייעוץ או המלצה פיננסית, השקעתית, מסחרית או מכל סוג אחר המסופקת או מאושרת על ידי TradingView. קרא עוד ב־תנאי השימוש.