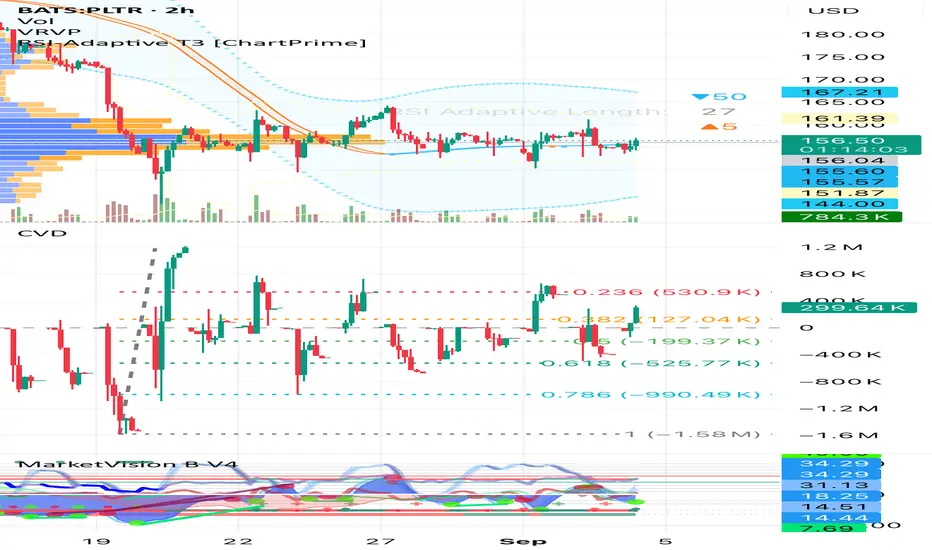
Cumulative delta is often used to try and get a picture of the real condensed price action as it is all buys minus all sales.
But I never see anyone doing TA on CVD candles even though it makes perfect sense.
So I’ve done it here with Fib Retracement as an experiment and it looks significant to me, I need to also use Non cumulative delta volume bars and perform the same analysis but my concept is:
But I never see anyone doing TA on CVD candles even though it makes perfect sense.
So I’ve done it here with Fib Retracement as an experiment and it looks significant to me, I need to also use Non cumulative delta volume bars and perform the same analysis but my concept is:
- let’s be reductive as there’s always so much noise
- why not draw classic patterns on cvd as it would be similar to drawing them on tick or volume based charts
כתב ויתור
המידע והפרסומים אינם מיועדים להיות, ואינם מהווים, ייעוץ או המלצה פיננסית, השקעתית, מסחרית או מכל סוג אחר המסופקת או מאושרת על ידי TradingView. קרא עוד ב־תנאי השימוש.
כתב ויתור
המידע והפרסומים אינם מיועדים להיות, ואינם מהווים, ייעוץ או המלצה פיננסית, השקעתית, מסחרית או מכל סוג אחר המסופקת או מאושרת על ידי TradingView. קרא עוד ב־תנאי השימוש.