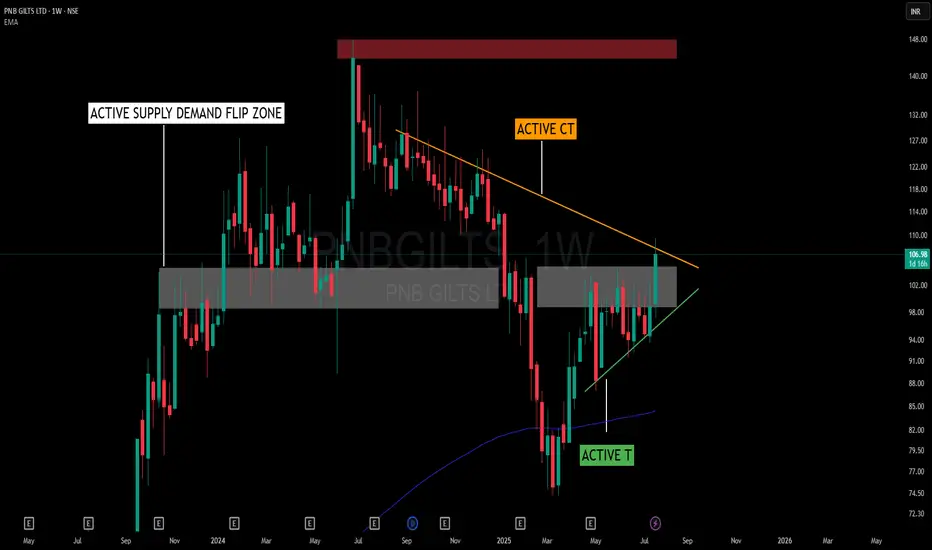
This chart presents an interesting interaction between structure and zone dynamics without adhering to a textbook pattern name. The price is being squeezed within a random, yet well-defined structural form, shaped by the forces of support and resistance.
📌 Key Structural Notes:
🟠 Active Counter Trendline (CT) – Acting as overhead resistance, capping price for several weeks.
🟢 Rising Trendline (T) – Offering a base of support, encouraging higher lows and structural tightening.
🟫 Supply-Demand Flip Zone – A previously reactive supply zone now serving a dual role, showing consistent relevance to price behavior.
🟥 Major Supply Overhead – Remains untested, yet significant from a broader structure perspective.
Rather than labeling this as a triangle or cup-handle, it’s more about how CT and T are working together to compress price into a decision area. The presence of the flip zone adds to the friction, making this a valuable case to observe from a structural and behavioral standpoint.
🧠 Not a prediction or setup – just a visual study of how structure evolves when opposing pressures meet within a contextual zone.
🎯 Master My Self-Made Trading Strategy
📈 Telegram (Learn Today): t.me/hashtaghammer
✅ WhatsApp (Learn Today): wa.me/919455664601
📈 Telegram (Learn Today): t.me/hashtaghammer
✅ WhatsApp (Learn Today): wa.me/919455664601
פרסומים קשורים
כתב ויתור
המידע והפרסומים אינם מיועדים להיות, ואינם מהווים, ייעוץ או המלצה פיננסית, השקעתית, מסחרית או מכל סוג אחר המסופקת או מאושרת על ידי TradingView. קרא עוד ב־תנאי השימוש.