PNUT/USDT – Breakout Watch from Symmetrical Triangle
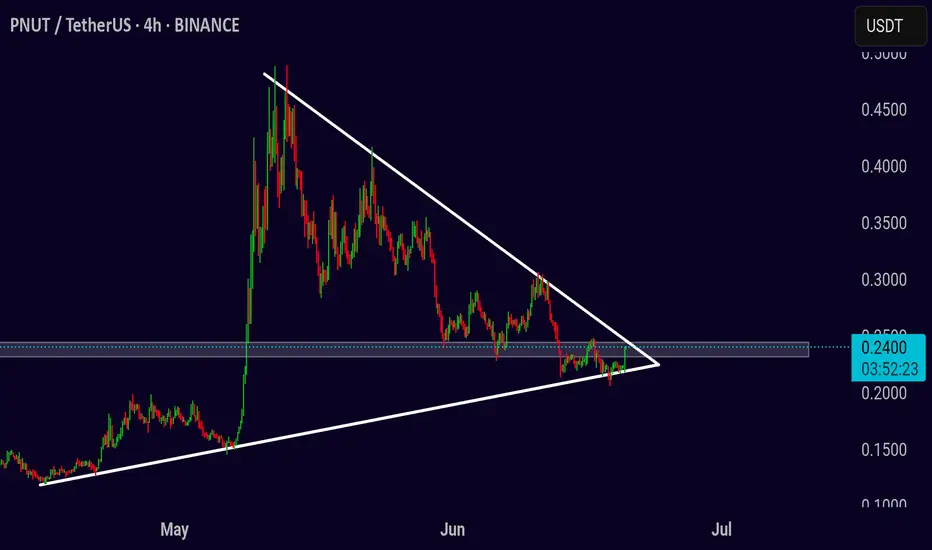
Chart pattern: Symmetrical Triangle
Timeframe: 4-Hour
Published: June 20, 2025
PNUT/USDT is nearing the apex of a symmetrical triangle that has been forming over several weeks. The price is tightening between rising support and descending resistance, indicating a breakout is likely approaching soon.
Price is currently testing the upper boundary near 0.24. A breakout from this level with strong volume may trigger a bullish move, while rejection could keep price inside the range a little longer.
Bullish scenario
Entry: 4H close above 0.245 with volume
Target 1: 0.28
Target 2: 0.33
Stop-loss: Below 0.22
Bearish scenario
Entry: Break below 0.215
Target 1: 0.18
Target 2: 0.14
Stop-loss: Above 0.24
Wait for confirmation before acting — momentum will likely follow once the triangle breaks.
🚀 Join My Telegram Community for FREE trading signals, entry/exit points, and instant updates!
👉 t.me/cryptobyghazii
👉 t.me/cryptobyghazii
כתב ויתור
המידע והפרסומים אינם אמורים להיות, ואינם מהווים, עצות פיננסיות, השקעות, מסחר או סוגים אחרים של עצות או המלצות שסופקו או מאושרים על ידי TradingView. קרא עוד בתנאים וההגבלות.