🔍 Technical Highlights
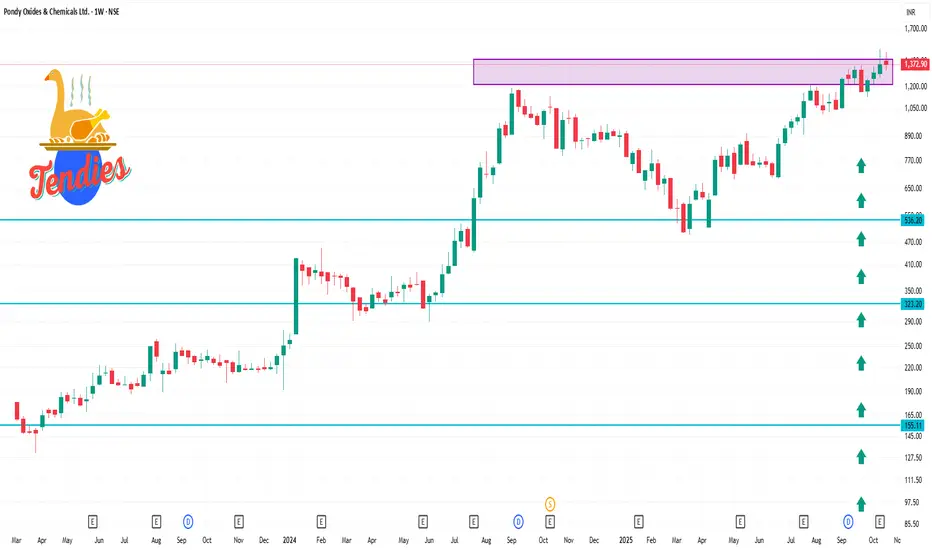
52-Week Range: ₹490.00 – ₹1,507.05
Current Price: ₹1,372.90
Beta: -0.68, indicating lower volatility compared to the market
Relative Strength Index (RSI): 59.08, suggesting the stock is neither overbought nor oversold
50-Day Moving Average: ₹1,222.79
200-Day Moving Average: ₹886.54
52-Week Range: ₹490.00 – ₹1,507.05
Current Price: ₹1,372.90
Beta: -0.68, indicating lower volatility compared to the market
Relative Strength Index (RSI): 59.08, suggesting the stock is neither overbought nor oversold
50-Day Moving Average: ₹1,222.79
200-Day Moving Average: ₹886.54
פרסומים קשורים
כתב ויתור
המידע והפרסומים אינם מיועדים להיות, ואינם מהווים, ייעוץ או המלצה פיננסית, השקעתית, מסחרית או מכל סוג אחר המסופקת או מאושרת על ידי TradingView. קרא עוד ב־תנאי השימוש.
פרסומים קשורים
כתב ויתור
המידע והפרסומים אינם מיועדים להיות, ואינם מהווים, ייעוץ או המלצה פיננסית, השקעתית, מסחרית או מכל סוג אחר המסופקת או מאושרת על ידי TradingView. קרא עוד ב־תנאי השימוש.