📊 Key levels & structure
Based on current weekly chart readings, recent pivot data and visible support/resistance zones:
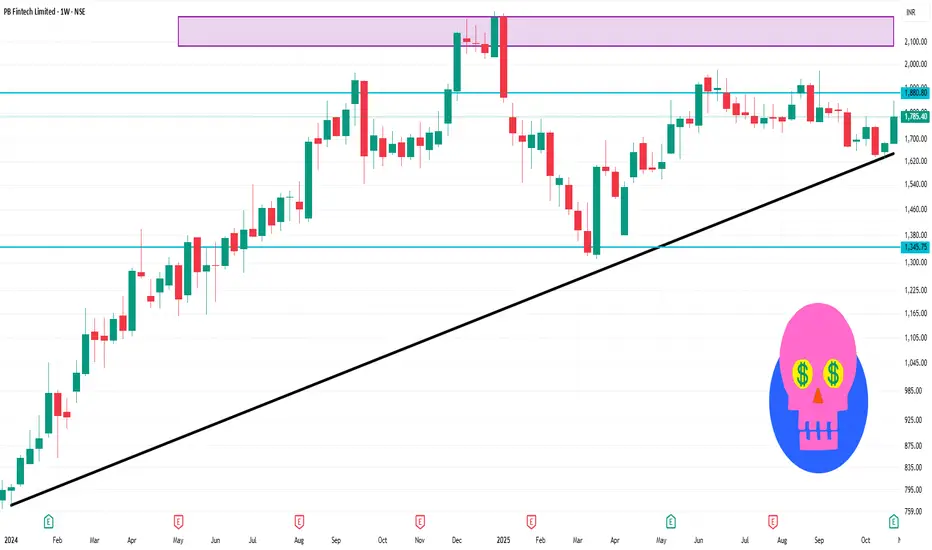
Resistance zone: ~ ₹1,775-1,825 — price has been tested around this area, acting as a cap.
Support zone: ~ ₹1,650-1,620 — key lower bounds that have held in recent pullbacks.
Intermediate pivot / trigger area: ~ ₹1,700-₹1,740 — if this area gives way, next leg down could accelerate; if it holds, potential bounce.
Weekly trend: The stock is below its 50- and 200-week moving averages, signalling caution for bulls.
Momentum: RSI in mid‐range, ADX weak, so trend strength is moderate.
Based on current weekly chart readings, recent pivot data and visible support/resistance zones:
Resistance zone: ~ ₹1,775-1,825 — price has been tested around this area, acting as a cap.
Support zone: ~ ₹1,650-1,620 — key lower bounds that have held in recent pullbacks.
Intermediate pivot / trigger area: ~ ₹1,700-₹1,740 — if this area gives way, next leg down could accelerate; if it holds, potential bounce.
Weekly trend: The stock is below its 50- and 200-week moving averages, signalling caution for bulls.
Momentum: RSI in mid‐range, ADX weak, so trend strength is moderate.
פרסומים קשורים
כתב ויתור
המידע והפרסומים אינם אמורים להיות, ואינם מהווים, עצות פיננסיות, השקעות, מסחר או סוגים אחרים של עצות או המלצות שסופקו או מאושרים על ידי TradingView. קרא עוד בתנאים וההגבלות.
פרסומים קשורים
כתב ויתור
המידע והפרסומים אינם אמורים להיות, ואינם מהווים, עצות פיננסיות, השקעות, מסחר או סוגים אחרים של עצות או המלצות שסופקו או מאושרים על ידי TradingView. קרא עוד בתנאים וההגבלות.