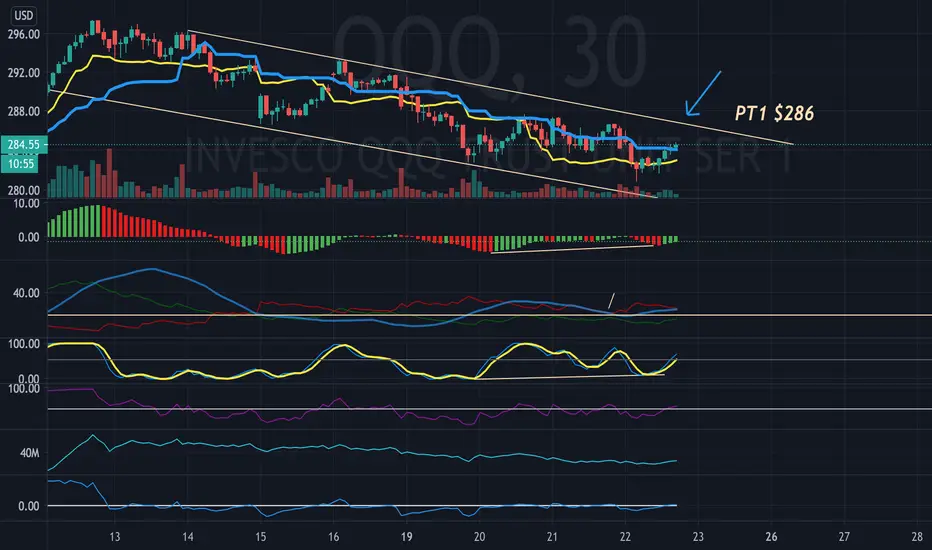
30 min chart showing bullish divergence for RSI and STOC.
60 min chart has a possible pin bar.
Overall trend is still down on 4 hour chart until 286 is broken to the upside decisively.
1st price target 286. then will probably fail at the top channel line and continue bearish trend.
PT1 286
PT 2 269
Disclaimer, this is only for entertainment and education purposes and doesn't serve by any means as a buy or sell recommendation.
Personally I hold both long term long positions and occasionally short term short position, for disclosure purpose.
כתב ויתור
המידע והפרסומים אינם אמורים להיות, ואינם מהווים, עצות פיננסיות, השקעות, מסחר או סוגים אחרים של עצות או המלצות שסופקו או מאושרים על ידי TradingView. קרא עוד בתנאים וההגבלות.
כתב ויתור
המידע והפרסומים אינם אמורים להיות, ואינם מהווים, עצות פיננסיות, השקעות, מסחר או סוגים אחרים של עצות או המלצות שסופקו או מאושרים על ידי TradingView. קרא עוד בתנאים וההגבלות.