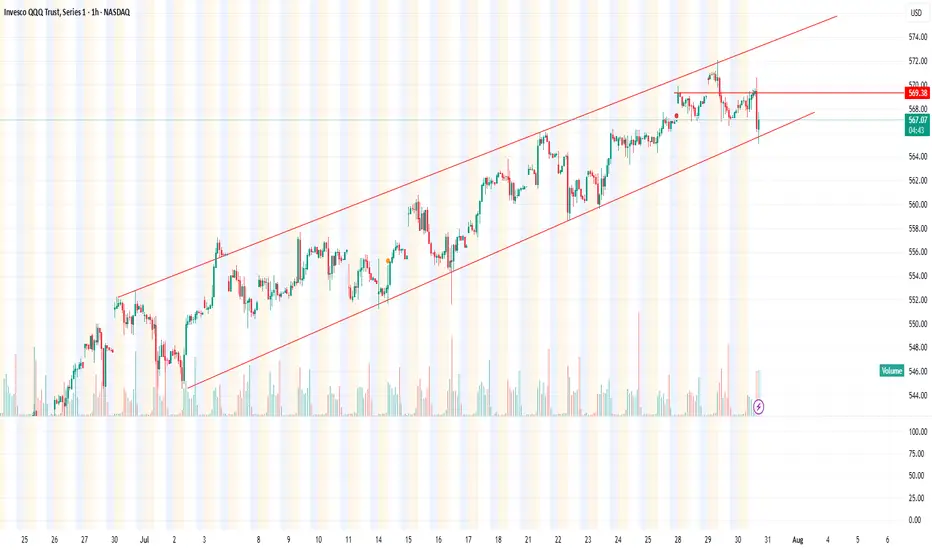
Key Observations:
Uptrend Channel:
QQQ has been trading within a rising channel.
The price respects both the support (lower red trendline) and resistance (upper red trendline) consistently.
Recent Price Action:
There was a sharp drop that briefly broke below the lower trendline support but quickly rebounded back inside the channel, indicating a false breakdown or buying strength at support.
A horizontal red line marks a previous resistance level, now potentially acting as a support.
Current Price:
The price is around $567.22, near the middle of the channel, but just below the recent local high/resistance.
Implication:
As long as the price stays within the channel, the uptrend remains intact.
A confirmed breakdown below the channel support would be bearish, while a breakout above the channel resistance would be bullish.
כתב ויתור
המידע והפרסומים אינם אמורים להיות, ואינם מהווים, עצות פיננסיות, השקעות, מסחר או סוגים אחרים של עצות או המלצות שסופקו או מאושרים על ידי TradingView. קרא עוד בתנאים וההגבלות.
כתב ויתור
המידע והפרסומים אינם אמורים להיות, ואינם מהווים, עצות פיננסיות, השקעות, מסחר או סוגים אחרים של עצות או המלצות שסופקו או מאושרים על ידי TradingView. קרא עוד בתנאים וההגבלות.