Okay, so here is my annual Halloween themed post! Have to stick to tradition I guess.
Here I am sharing intra-day predictions in anticipation for FOMC release tomorrow.
The FEDS are between a rock and a hard place. As the Federal reserve depends on the federal government to release statistics, it is missing quite a bit of the data it would use to make decisions. While CPI was released last week which was high but showed inflation still "cooling", this is only part of the picture the FEDS consider.
In determining the appropriateness of rate cuts or hikes, these fundamental metrics are what the federal reserve considers:
Here are the data the FEDS are missing going into the release tomorrow:
Let's take a look at the 20-Year Bond Market:

This chart shows a large descending wedge pattern that has recently broken to the upside, generally a bullish indication. The wedge, defined by lower highs and lower lows since early 2024, reflects a long period of declining momentum that appears to have been exhausted. The breakout above the upper trendline suggests that sellers are losing control and a potential trend reversal may be underway. As long as price remains above the broken resistance (~$44.50), the next technical targets could lie in the $46.50–$47.50 zone, while a close back below $44 would negate the breakout and reintroduce downside risk.
This is generally a sign of bearishness for the larger market, but a bullish indication for government bonds.
Why is this? For some reasons, namely:
Be that as it may, the CME group estimates a > 95% probability that the feds will cut rates by at least 25 basis points. And this would be bullish, if and only if, the market hasn't already priced in a 25 basis point cut. If we notice the rallying into FOMC, it tells you something.. the market has expectations that they are already betting on.
I know, this is all boring. What about QQQ from a technical/math and momentum perspective?
On the hourly, QQQ has incredibly bullish momentum, which we can visualize using the momentum probability oscillator:

We can see that, on the hourly, QQQ is holding well above the momentum mean, indicating persistent trendiness backed but a ton of momentum.
That is not to say that this can't fail at any point, but it is completely momentum fueled right now.
But what about the math? If we look at QQQ on the weekly perspective:

We can see that QQQ is pushing the 99% confidence level. Historically, QQQ has closed above this range only 2.02% of the time, putting the odds that we hold here or above at 2.02% probability.
Not great odds if you ask me and definitely a terrible R:R to long here if you are not already long.
The last thing I can share with you is my fundamental forecast model. I haven't shared this publicly before but I have trained a model to forecast fundamental catalysts, including FOMC.
Obviously it forecasts a ton of volatility tomorrow, but here it is:

As per usual, we can expect dramatic movement in both directions.
Verdict
If you watched my most recent idea on SPY, you know I remain bullish for at least another 4% upside into EOY.
However, here is not the place to buy, in my honest opinion. I do anticipate we should see some retracement to the downside before and further moves to the upside. Not because the market is super "over-extended", because that never really matters with momentum. But because the math predicts as such ;-).
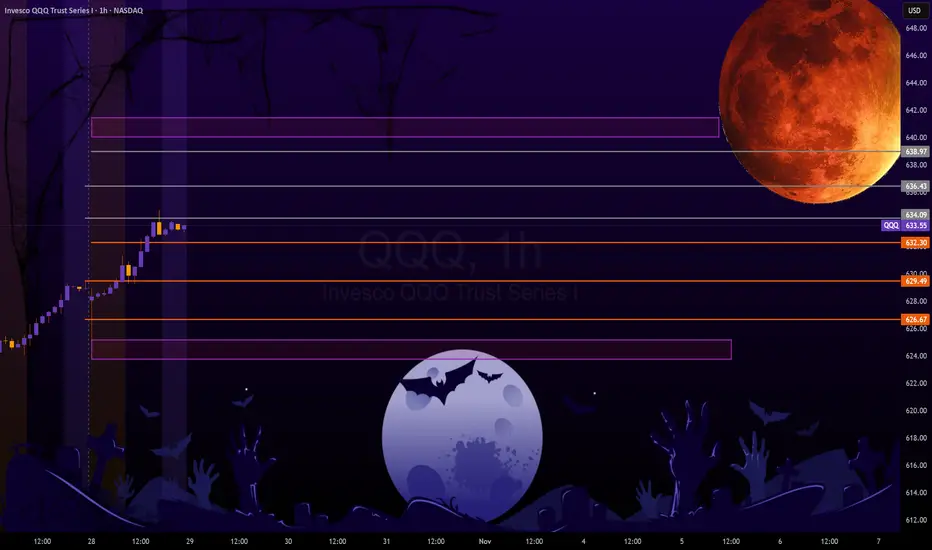
These are my thoughts. I have shared the intra-day levels in the main chart to guide you through the day tomorrow!
I wish you all safe trades and best of luck tomorrow!

Here I am sharing intra-day predictions in anticipation for FOMC release tomorrow.
The FEDS are between a rock and a hard place. As the Federal reserve depends on the federal government to release statistics, it is missing quite a bit of the data it would use to make decisions. While CPI was released last week which was high but showed inflation still "cooling", this is only part of the picture the FEDS consider.
In determining the appropriateness of rate cuts or hikes, these fundamental metrics are what the federal reserve considers:
- Economic Growth (GDP): If GDP contracts or grows sluggishly, the Fed may cut rates to stimulate investment and consumer spending. For example, a negative Q1 followed by weak Q2 growth raises recession concerns.
- Unemployment Trends: Rising unemployment signals labor market weakness. If job losses mount or hiring slows, the Fed may lower rates to encourage business expansion and hiring.
- Inflation Levels: The Fed targets 2% inflation. If inflation falls below this, rate cuts can help reflate the economy. But if inflation is still high (e.g., 3% in September 2025), they must tread carefully
- Financial System Stress: Signs of instability—like high volatility (VIX index), credit tightening, or banking stress—can prompt cuts to stabilize markets. Remember, JP directly mentioned how over-extended the market was! These are real considerations that the Fed is not blind to.
- Global Economic Conditions: Weakness abroad (e.g., low global PMI) can spill into U.S. exports and investment, prompting accommodative policy.
- Yield Curve and Policy Tightness: An inverted or steep yield curve suggests overly tight monetary policy. The Fed may cut rates to normalize the curve and avoid recession.
Here are the data the FEDS are missing going into the release tomorrow:
- September Employment Report:
- Job Openings and Labor Turnover Survey (JOLTS)
- Retail Sales Data
- Gross Domestic Product (or GDP)
- Trade Balance and Import / Export Data
Let's take a look at the 20-Year Bond Market:
This chart shows a large descending wedge pattern that has recently broken to the upside, generally a bullish indication. The wedge, defined by lower highs and lower lows since early 2024, reflects a long period of declining momentum that appears to have been exhausted. The breakout above the upper trendline suggests that sellers are losing control and a potential trend reversal may be underway. As long as price remains above the broken resistance (~$44.50), the next technical targets could lie in the $46.50–$47.50 zone, while a close back below $44 would negate the breakout and reintroduce downside risk.
This is generally a sign of bearishness for the larger market, but a bullish indication for government bonds.
Why is this? For some reasons, namely:
- UTWY rising means long-term Treasury prices are going up — and since bond prices move opposite to yields, this implies yields are falling.
- Falling yields typically signal that investors expect slower economic growth, cooling inflation, or increased demand for safety.
- In the early stages, declining yields can support equities (lower borrowing costs, valuation boost). But if yields are dropping because the market anticipates economic weakness or Fed easing due to slowdown, it can become bearish for risk assets like stocks and bullish for defensive assets like bonds and gold.
Be that as it may, the CME group estimates a > 95% probability that the feds will cut rates by at least 25 basis points. And this would be bullish, if and only if, the market hasn't already priced in a 25 basis point cut. If we notice the rallying into FOMC, it tells you something.. the market has expectations that they are already betting on.
I know, this is all boring. What about QQQ from a technical/math and momentum perspective?
On the hourly, QQQ has incredibly bullish momentum, which we can visualize using the momentum probability oscillator:
We can see that, on the hourly, QQQ is holding well above the momentum mean, indicating persistent trendiness backed but a ton of momentum.
That is not to say that this can't fail at any point, but it is completely momentum fueled right now.
But what about the math? If we look at QQQ on the weekly perspective:
We can see that QQQ is pushing the 99% confidence level. Historically, QQQ has closed above this range only 2.02% of the time, putting the odds that we hold here or above at 2.02% probability.
Not great odds if you ask me and definitely a terrible R:R to long here if you are not already long.
The last thing I can share with you is my fundamental forecast model. I haven't shared this publicly before but I have trained a model to forecast fundamental catalysts, including FOMC.
Obviously it forecasts a ton of volatility tomorrow, but here it is:
As per usual, we can expect dramatic movement in both directions.
Verdict
If you watched my most recent idea on SPY, you know I remain bullish for at least another 4% upside into EOY.
However, here is not the place to buy, in my honest opinion. I do anticipate we should see some retracement to the downside before and further moves to the upside. Not because the market is super "over-extended", because that never really matters with momentum. But because the math predicts as such ;-).
These are my thoughts. I have shared the intra-day levels in the main chart to guide you through the day tomorrow!
I wish you all safe trades and best of luck tomorrow!
הערה
And that's a wrap folks!Pullback as expected! Was a really solid setup with QQQ at the 99% level on the week.
And its Halloween today!
Happy Halloween everyone :D
Get:
- Live Updates,
- Discord access,
- Access to my Proprietary Merlin Software,
- Access to premium indicators,
patreon.com/steversteves
Now on X!
- Live Updates,
- Discord access,
- Access to my Proprietary Merlin Software,
- Access to premium indicators,
patreon.com/steversteves
Now on X!
כתב ויתור
המידע והפרסומים אינם אמורים להיות, ואינם מהווים, עצות פיננסיות, השקעות, מסחר או סוגים אחרים של עצות או המלצות שסופקו או מאושרים על ידי TradingView. קרא עוד בתנאים וההגבלות.