🔍 Current price snapshot
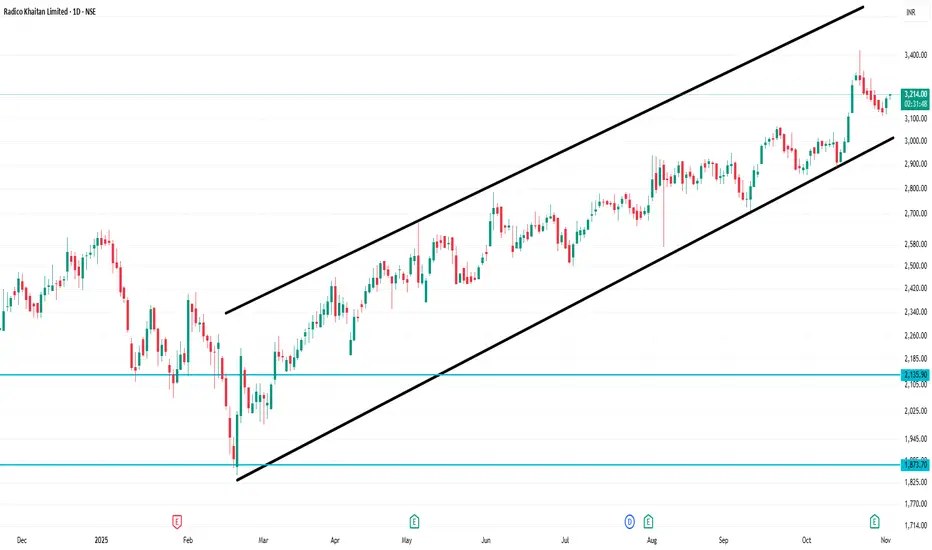
Recent price: ~ ₹3,220 on the NSE.
The stock has its 52-week high around ~ ₹3,423 and 52-week low around ~ ₹1,845.
📈 Key technical levels (1-day frame)
Based on available pivot / support/resistance data:
Pivot (daily): ~ ₹2,831.17.
Immediate supports: ~ ₹2,777.77 (S2) and ~ ₹2,800.93 (S1).
Immediate resistances: ~ ₹2,884.57 (R2) and ~ ₹2,907.73 (R3).
Using another source: Support ~ ₹3,143.31 and ~ ₹3,125.26; Resistance ~ ~₹3,219.81 & ~₹3,249.03.
פרסומים קשורים
כתב ויתור
המידע והפרסומים אינם מיועדים להיות, ואינם מהווים, ייעוץ או המלצה פיננסית, השקעתית, מסחרית או מכל סוג אחר המסופקת או מאושרת על ידי TradingView. קרא עוד ב־תנאי השימוש.
פרסומים קשורים
כתב ויתור
המידע והפרסומים אינם מיועדים להיות, ואינם מהווים, ייעוץ או המלצה פיננסית, השקעתית, מסחרית או מכל סוג אחר המסופקת או מאושרת על ידי TradingView. קרא עוד ב־תנאי השימוש.