Topic Statement:
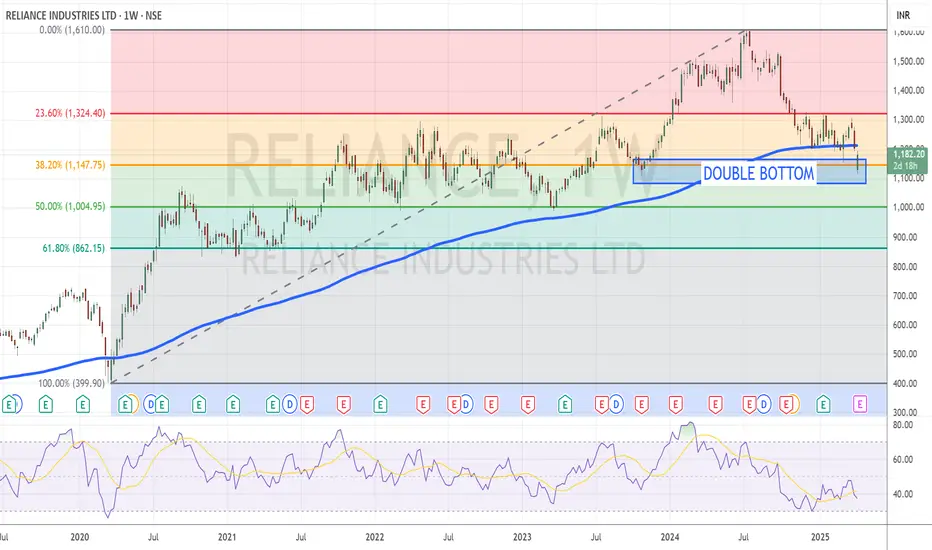
Reliance has undergone a healthy correction in line with the broader market and is showing signs of a potential reversal from key support levels.
Key Points:
- The stock is taking strong support at the 38.2% Fibonacci retracement level near ₹1147.
- Candlestick pattern indicates the formation of a potential double bottom.
- Price is trading below the 180-day EMA, suggesting an oversold condition.
- Weekly RSI stands at 37.5, further confirming the stock is in an oversold zone.
כתב ויתור
המידע והפרסומים אינם אמורים להיות, ואינם מהווים, עצות פיננסיות, השקעות, מסחר או סוגים אחרים של עצות או המלצות שסופקו או מאושרים על ידי TradingView. קרא עוד בתנאים וההגבלות.
כתב ויתור
המידע והפרסומים אינם אמורים להיות, ואינם מהווים, עצות פיננסיות, השקעות, מסחר או סוגים אחרים של עצות או המלצות שסופקו או מאושרים על ידי TradingView. קרא עוד בתנאים וההגבלות.