📊 Monthly Pivot Levels (Standard)
Pivot Point: ₹1,375.53
Support Levels:
S1: ₹1,329.07
S2: ₹1,294.13
S3: ₹1,247.67
Resistance Levels:
R1: ₹1,410.47
R2: ₹1,456.93
R3: ₹1,491.87
These levels are derived from standard pivot point calculations, which are commonly used to identify potential support and resistance zones.
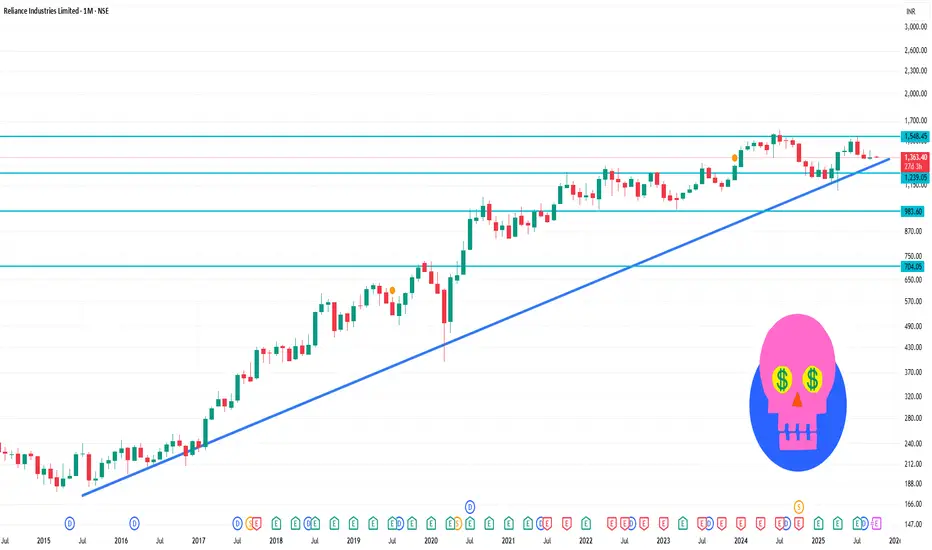
🔄 Technical Indicators Overview
Relative Strength Index (RSI): Approximately 41.5, indicating a neutral to slightly bearish condition.
Moving Averages: The stock is trading below its 50-day and 200-day moving averages, suggesting a bearish trend.
MACD: Currently negative, reinforcing the bearish momentum.
Pivot Point: ₹1,375.53
Support Levels:
S1: ₹1,329.07
S2: ₹1,294.13
S3: ₹1,247.67
Resistance Levels:
R1: ₹1,410.47
R2: ₹1,456.93
R3: ₹1,491.87
These levels are derived from standard pivot point calculations, which are commonly used to identify potential support and resistance zones.
🔄 Technical Indicators Overview
Relative Strength Index (RSI): Approximately 41.5, indicating a neutral to slightly bearish condition.
Moving Averages: The stock is trading below its 50-day and 200-day moving averages, suggesting a bearish trend.
MACD: Currently negative, reinforcing the bearish momentum.
פרסומים קשורים
כתב ויתור
המידע והפרסומים אינם מיועדים להיות, ואינם מהווים, ייעוץ או המלצה פיננסית, השקעתית, מסחרית או מכל סוג אחר המסופקת או מאושרת על ידי TradingView. קרא עוד ב־תנאי השימוש.
פרסומים קשורים
כתב ויתור
המידע והפרסומים אינם מיועדים להיות, ואינם מהווים, ייעוץ או המלצה פיננסית, השקעתית, מסחרית או מכל סוג אחר המסופקת או מאושרת על ידי TradingView. קרא עוד ב־תנאי השימוש.