📊 Intraday Price Movement
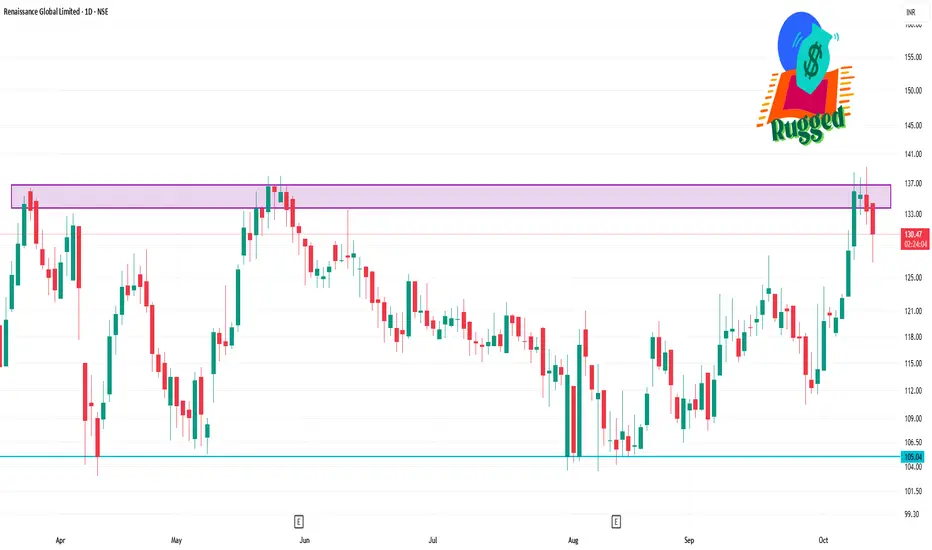
Opening Price: ₹135.00
Day's Range: ₹131.60 – ₹139.21
Previous Close: ₹135.46
Volume Traded: Approximately 711,000 shares
Market Cap: ₹1,453.32 crore
🔧 Technical Indicators
Relative Strength Index (RSI): 72.25, indicating potential overbought conditions
Moving Average Convergence Divergence (MACD): 0.82, suggesting a bullish trend.
Support Levels: ₹130.00 and ₹131.60
Resistance Levels: ₹135.46 and ₹139.21
📈 52-Week Range
High: ₹207.40
Low: ₹103.01
פרסומים קשורים
כתב ויתור
המידע והפרסומים אינם מיועדים להיות, ואינם מהווים, ייעוץ או המלצה פיננסית, השקעתית, מסחרית או מכל סוג אחר המסופקת או מאושרת על ידי TradingView. קרא עוד ב־תנאי השימוש.
פרסומים קשורים
כתב ויתור
המידע והפרסומים אינם מיועדים להיות, ואינם מהווים, ייעוץ או המלצה פיננסית, השקעתית, מסחרית או מכל סוג אחר המסופקת או מאושרת על ידי TradingView. קרא עוד ב־תנאי השימוש.