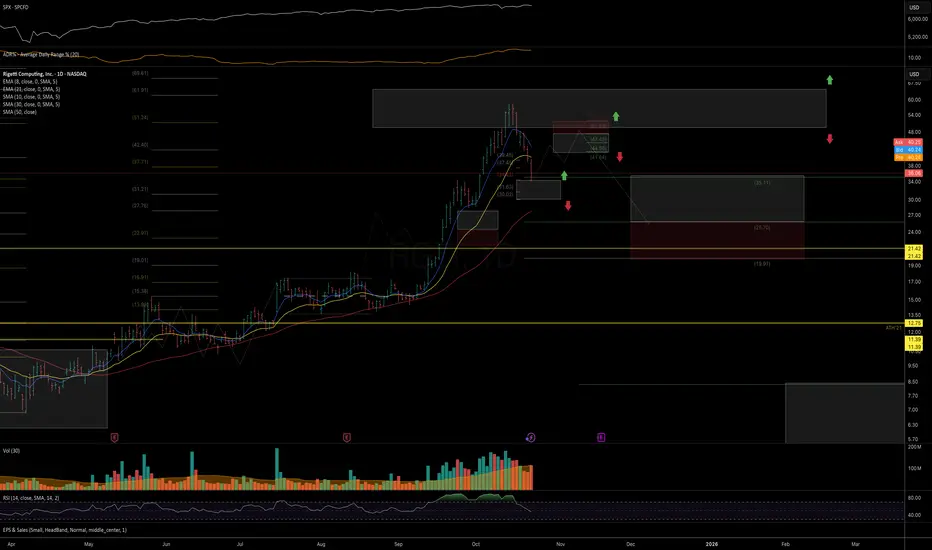
Price reacted as expected from the key resistance outlined in the October update.
The main hypothesis remains that price has likely topped and is now completing its first wave of decline.
Any upcoming recovery attempt will be considered a bounce and potential lower high formation before further downside later this year.
Chart:

In the broader context, the critical zone to monitor is the 35–25 support area.
If price manages to stage an impulsive 5-wave recovery from this zone, the probability for another upside leg toward the next macro resistance at 85–115 will remain valid.
However, if the recovery from this area unfolds as a corrective 3-wave structure, then a breakdown below the Dec’24 top and continuation into the macro support zone will become the higher-probability scenario.
Chart (weekly):

Previous Updates
• On macro resistance and potential topping (Oct 13)
Chart:
View Idea
• On support and pullback potential (Sep 24)
Chart:
View Idea
• On macro structure (Sep 18)
Chart:
View Idea
The main hypothesis remains that price has likely topped and is now completing its first wave of decline.
Any upcoming recovery attempt will be considered a bounce and potential lower high formation before further downside later this year.
Chart:
In the broader context, the critical zone to monitor is the 35–25 support area.
If price manages to stage an impulsive 5-wave recovery from this zone, the probability for another upside leg toward the next macro resistance at 85–115 will remain valid.
However, if the recovery from this area unfolds as a corrective 3-wave structure, then a breakdown below the Dec’24 top and continuation into the macro support zone will become the higher-probability scenario.
Chart (weekly):
Previous Updates
• On macro resistance and potential topping (Oct 13)
Chart:
View Idea
• On support and pullback potential (Sep 24)
Chart:
View Idea
• On macro structure (Sep 18)
Chart:
View Idea
עסקה פעילה
Quantum sector in general, and Alternatively, there’s a possibility of one more short-term upside attempt into the 47–52 zone. However, given the current macro structure, I still lean toward a mid-term downside scenario.
Chart:
📊 Daily FREE Market Insights | Crypto + US Stocks
⚡ Technical analysis, setups & commentary
🌍 t.me/MarketArtistryENG | 🇷🇺 t.me/marketartistry
Join and let's grow together! 🚀
⚡ Technical analysis, setups & commentary
🌍 t.me/MarketArtistryENG | 🇷🇺 t.me/marketartistry
Join and let's grow together! 🚀
כתב ויתור
המידע והפרסומים אינם אמורים להיות, ואינם מהווים, עצות פיננסיות, השקעות, מסחר או סוגים אחרים של עצות או המלצות שסופקו או מאושרים על ידי TradingView. קרא עוד בתנאים וההגבלות.