📊 Technical Overview
Current Price: ₹445.00
Day’s Range: ₹440.00 – ₹453.10
Previous Close: ₹451.45
52-Week Range: ₹376.45 – ₹640.00
🔻 Bearish Indicators
RSI (14): 24.86 — Oversold condition, suggesting potential for a rebound.
MACD: -7.80 — Indicates downward momentum.
Moving Averages:
5-day: ₹444.48 — Slightly above current price.
50-day: ₹469.06 — Bearish crossover.
200-day: ₹478.22 — Further confirmation of downtrend.
Technical Indicators: Strong Sell signals across multiple platforms.
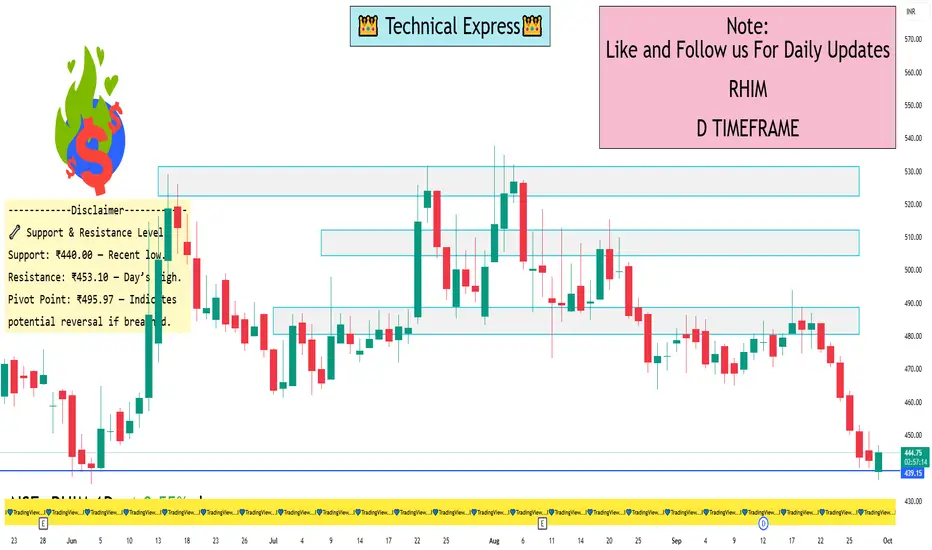
🔧 Support & Resistance Levels
Support: ₹440.00 — Recent low.
Resistance: ₹453.10 — Day’s high.
Pivot Point: ₹495.97 — Indicates potential reversal if breached.
⚠️ Summary
RHI Magnesita India Ltd is currently in a downtrend, with technical indicators signaling a strong sell. The stock is approaching key support levels, and while it is oversold, caution is advised. Traders should monitor for any bullish reversal patterns or volume spikes before considering entry points.
Current Price: ₹445.00
Day’s Range: ₹440.00 – ₹453.10
Previous Close: ₹451.45
52-Week Range: ₹376.45 – ₹640.00
🔻 Bearish Indicators
RSI (14): 24.86 — Oversold condition, suggesting potential for a rebound.
MACD: -7.80 — Indicates downward momentum.
Moving Averages:
5-day: ₹444.48 — Slightly above current price.
50-day: ₹469.06 — Bearish crossover.
200-day: ₹478.22 — Further confirmation of downtrend.
Technical Indicators: Strong Sell signals across multiple platforms.
🔧 Support & Resistance Levels
Support: ₹440.00 — Recent low.
Resistance: ₹453.10 — Day’s high.
Pivot Point: ₹495.97 — Indicates potential reversal if breached.
⚠️ Summary
RHI Magnesita India Ltd is currently in a downtrend, with technical indicators signaling a strong sell. The stock is approaching key support levels, and while it is oversold, caution is advised. Traders should monitor for any bullish reversal patterns or volume spikes before considering entry points.
I built a Buy & Sell Signal Indicator with 85% accuracy.
📈 Get access via DM or
WhatsApp: wa.link/d997q0
Contact - +91 76782 40962
| Email: techncialexpress@gmail.com
| Script Coder | Trader | Investor | From India
📈 Get access via DM or
WhatsApp: wa.link/d997q0
Contact - +91 76782 40962
| Email: techncialexpress@gmail.com
| Script Coder | Trader | Investor | From India
פרסומים קשורים
כתב ויתור
המידע והפרסומים אינם מיועדים להיות, ואינם מהווים, ייעוץ או המלצה פיננסית, השקעתית, מסחרית או מכל סוג אחר המסופקת או מאושרת על ידי TradingView. קרא עוד ב־תנאי השימוש.