Company Overview: An Offshore Drilling Specialist
Transocean Ltd. ( RIG) is a leading global provider of offshore contract drilling services for oil and gas wells. With a history dating back to 1953, the company possesses significant industry experience and owns and operates one of the world's most versatile offshore drilling fleets. This fleet includes specialized rigs capable of operating in various challenging environments, such as ultra-deepwater, harsh environments, and conventional deepwater and midwater regions. As a "pure-play" offshore driller, Transocean's financial performance is highly correlated with global crude oil prices and the capital expenditure cycles of major oil and gas producers.
Technical Analysis: Navigating an Ascending Channel
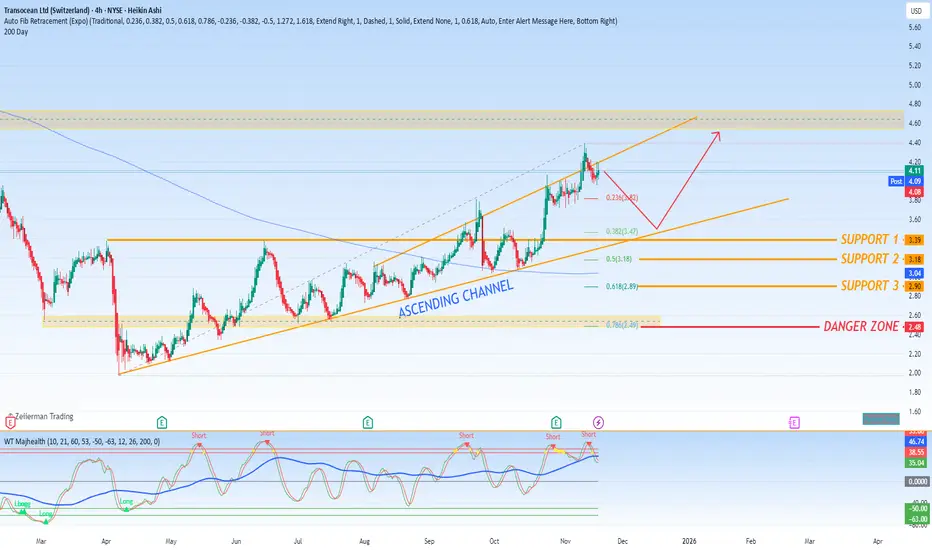
The price action forRIG is currently unfolding within a well-defined Ascending Channel, a technical pattern that typically indicates a sustained but controlled uptrend.
Pattern Structure: This pattern is characterized by two upward-sloping trendlines that contain the price action. The lower trendline acts as dynamic support, connecting the series of higher lows, while the upper trendline acts as dynamic resistance, connecting the series of higher highs. Trading within this channel suggests a balance of bullish momentum and periodic profit-taking.
Key Support Hierarchy:
Within this ascending structure, a hierarchy of critical support levels has been established, providing clear markers for the trend's health.
Primary Support (Channel Floor): ~$3.40 - This is the most immediate and crucial support, defined by the ascending trendline of the channel itself. A bounce from this level maintains the bullish pattern's integrity.
Secondary Support (0.50 Fibonacci): $3.18 - A break below the channel support would likely lead to a test of this key Fibonacci retracement level. This represents a deeper, yet still reasonable, pullback within the context of the prior upward move.
Tertiary Support (0.618 Fibonacci): $2.89 - This is a critical level; a breach here would signal a significant weakening of the bullish structure and suggest a potential trend reversal is underway.
The "Danger Zone": $2.50
The $2.50 level is correctly identified as the "danger zone." A decisive breakdown and close below this level would represent a clear and strong bearish signal. It would not only violate the Fibonacci support structure but would also likely indicate a complete failure of the ascending channel pattern, potentially triggering a more severe decline as the technical foundation collapses.
Synthesis and Strategic Outlook
RIG is in a technically constructive uptrend as long as it remains within the confines of its ascending channel. The pattern provides a clear framework for managing risk and identifying potential entry and exit points.
Bullish Scenario: The bullish outlook remains valid as long as the price holds above the primary channel support (~$3.40). Traders may look for bounce opportunities near this lower trendline, targeting a move toward the upper channel boundary.
Bearish/Cautionary Scenario: A break below the $3.40 support shifts the near-term bias to cautious. The $3.18 and $2.89 levels then become critical lines of defense. A final breakdown into the "danger zone" below $2.50 would be a strong signal to exit long positions, as it indicates a high probability of a major trend reversal and a move to significantly lower prices.
Conclusion:
While the ascending channel paints a bullish picture, the concentrated support levels beneath the current price highlight the importance of disciplined risk management. Investors should monitor the price action around the $3.40 support closely. Holding this level keeps the uptrend intact, but a breakdown through the subsequent Fibonacci levels and into the $2.50 danger zone would fundamentally alter the technical picture from bullish to bearish.
Transocean Ltd. (
Technical Analysis: Navigating an Ascending Channel
The price action for
Pattern Structure: This pattern is characterized by two upward-sloping trendlines that contain the price action. The lower trendline acts as dynamic support, connecting the series of higher lows, while the upper trendline acts as dynamic resistance, connecting the series of higher highs. Trading within this channel suggests a balance of bullish momentum and periodic profit-taking.
Key Support Hierarchy:
Within this ascending structure, a hierarchy of critical support levels has been established, providing clear markers for the trend's health.
Primary Support (Channel Floor): ~$3.40 - This is the most immediate and crucial support, defined by the ascending trendline of the channel itself. A bounce from this level maintains the bullish pattern's integrity.
Secondary Support (0.50 Fibonacci): $3.18 - A break below the channel support would likely lead to a test of this key Fibonacci retracement level. This represents a deeper, yet still reasonable, pullback within the context of the prior upward move.
Tertiary Support (0.618 Fibonacci): $2.89 - This is a critical level; a breach here would signal a significant weakening of the bullish structure and suggest a potential trend reversal is underway.
The "Danger Zone": $2.50
The $2.50 level is correctly identified as the "danger zone." A decisive breakdown and close below this level would represent a clear and strong bearish signal. It would not only violate the Fibonacci support structure but would also likely indicate a complete failure of the ascending channel pattern, potentially triggering a more severe decline as the technical foundation collapses.
Synthesis and Strategic Outlook
Bullish Scenario: The bullish outlook remains valid as long as the price holds above the primary channel support (~$3.40). Traders may look for bounce opportunities near this lower trendline, targeting a move toward the upper channel boundary.
Bearish/Cautionary Scenario: A break below the $3.40 support shifts the near-term bias to cautious. The $3.18 and $2.89 levels then become critical lines of defense. A final breakdown into the "danger zone" below $2.50 would be a strong signal to exit long positions, as it indicates a high probability of a major trend reversal and a move to significantly lower prices.
Conclusion:
While the ascending channel paints a bullish picture, the concentrated support levels beneath the current price highlight the importance of disciplined risk management. Investors should monitor the price action around the $3.40 support closely. Holding this level keeps the uptrend intact, but a breakdown through the subsequent Fibonacci levels and into the $2.50 danger zone would fundamentally alter the technical picture from bullish to bearish.
כתב ויתור
המידע והפרסומים אינם מיועדים להיות, ואינם מהווים, ייעוץ או המלצה פיננסית, השקעתית, מסחרית או מכל סוג אחר המסופקת או מאושרת על ידי TradingView. קרא עוד ב־תנאי השימוש.
כתב ויתור
המידע והפרסומים אינם מיועדים להיות, ואינם מהווים, ייעוץ או המלצה פיננסית, השקעתית, מסחרית או מכל סוג אחר המסופקת או מאושרת על ידי TradingView. קרא עוד ב־תנאי השימוש.