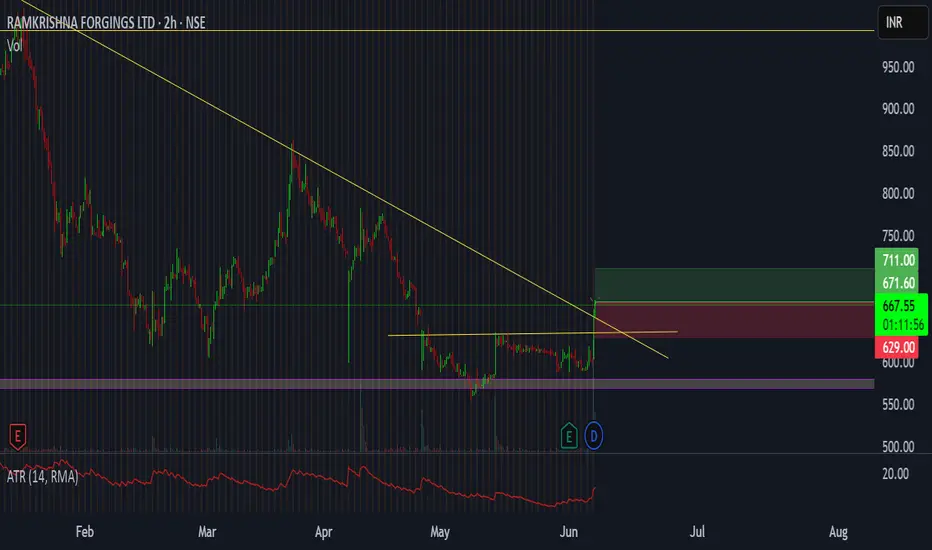
The area around 575 is a strong support on daily and weekly chart (long term support),
In the last four months, the stock has bounced off from around this level with a rise in volume,
every time higher than the previous,
A triangular pattern is also visible , having formed during this period, and now a small rectangular pattern is also visible,
A breakout through all of these has occurred today
Thus, for a short term trade,
tgt 711, sl 629
עסקה סגורה: הגיע לסטופ
כתב ויתור
המידע והפרסומים אינם אמורים להיות, ואינם מהווים, עצות פיננסיות, השקעות, מסחר או סוגים אחרים של עצות או המלצות שסופקו או מאושרים על ידי TradingView. קרא עוד בתנאים וההגבלות.
כתב ויתור
המידע והפרסומים אינם אמורים להיות, ואינם מהווים, עצות פיננסיות, השקעות, מסחר או סוגים אחרים של עצות או המלצות שסופקו או מאושרים על ידי TradingView. קרא עוד בתנאים וההגבלות.