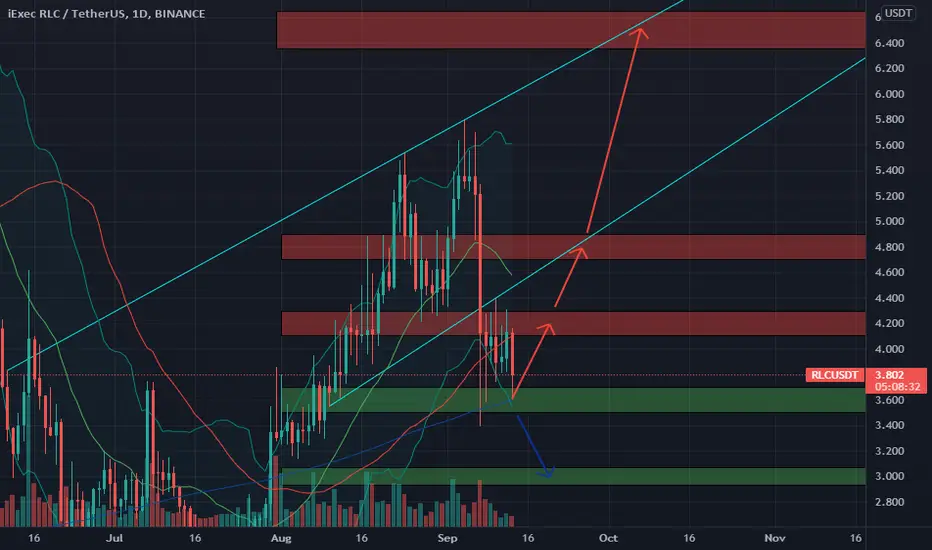
RLC is continuously recovering from the $3.6 zone and if it doesn't lose this zone, it will rally back to the $4,2, 4.8 and even $3.5 zone in the near term. But if it loses the $3.6 zone, it will fall back to the $3 zone
📈BUY
🔴Buy : 3.5-3.7$. SL if B
🔴Buy : 4.1-4.3$ if A. SL if B
🔴Buy : 4.7-4.9$ if A. SL if B
📉SELL
🔴Sell : 4.1-4.3$. SL if A
🔴Sell : 4.7-4.9$. SL if A
🔴Sell : 6.35-6.65$. SL if A
♻️BACK-UP
🔵Sell : 3.5-3.7 if B. SL if A
🔵Buy : 2.93-3.07$. SL if B
❓Details
📈Red Arrow : Main Direction as BUY and SELL section
📉Blue Arrow : Back-Up Direction as BACK-UP section
🟩Green zone : Support zone as BUY section
🟥Red zone : Resistance zone as SELL section
🅰️A : The Close price of 1-day candlestick is Above the zone
🅱️B : The Close price of 1-day candlestick is Below the zone
כתב ויתור
המידע והפרסומים אינם מיועדים להיות, ואינם מהווים, ייעוץ או המלצה פיננסית, השקעתית, מסחרית או מכל סוג אחר המסופקת או מאושרת על ידי TradingView. קרא עוד ב־תנאי השימוש.
כתב ויתור
המידע והפרסומים אינם מיועדים להיות, ואינם מהווים, ייעוץ או המלצה פיננסית, השקעתית, מסחרית או מכל סוג אחר המסופקת או מאושרת על ידי TradingView. קרא עוד ב־תנאי השימוש.