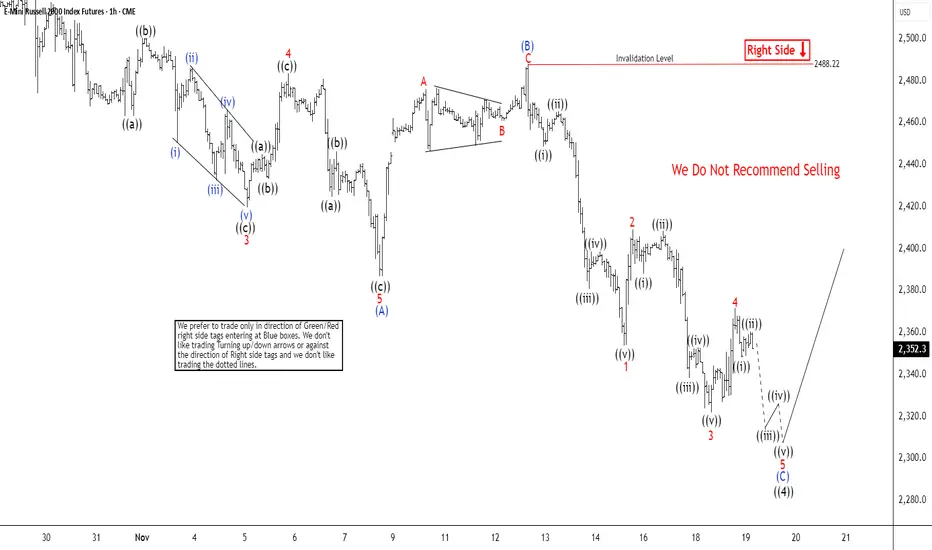
The short-term Elliott Wave outlook for the Russell 2000 Index (RTY) indicates that the decline from the October 25, 2025 peak is unfolding as a zigzag corrective structure. From that high, wave 1 concluded at 2473.9, followed by a corrective rally in wave 2 that terminated at 2517.2. The Index then extended lower in wave 3, reaching 2419.6. A brief recovery in wave 4 ended at 2483.4, while the final leg, wave 5, completed at 2386.6. This sequence marked the completion of wave (A) at a higher degree.
Subsequently, the Index corrected higher in wave (B), which concluded at 2486.67, as illustrated in the accompanying one-hour chart. From that point, the Index has resumed its descent in wave (C), which is unfolding internally as a five-wave diagonal. Within this structure, wave 1 ended at 2353.8, and the corrective rally in wave 2 peaked at 2409.1. Wave 3 then declined to 2321.9, followed by a modest rebound in wave 4 to 2371.6.
The Index is expected to extend lower in wave 5, thereby completing wave (C) of ((4)). The projected downside target lies within the 100%–161.8% Fibonacci extension range from the October 27 peak, spanning 2316.3 to 2307.4. In the near term, as long as the pivot high at 2486.6 remains intact, any rally is anticipated to fail in three, seven, or eleven swings, paving the way for further downside pressure.
14 days trial --> elliottwave-forecast.com/plan-trial/ and get Accurate & timely Elliott Wave Forecasts of 78 instruments. Webinars, Chat Room, Stocks/Forex/Indices Signals & more.
כתב ויתור
המידע והפרסומים אינם מיועדים להיות, ואינם מהווים, ייעוץ או המלצה פיננסית, השקעתית, מסחרית או מכל סוג אחר המסופקת או מאושרת על ידי TradingView. קרא עוד ב־תנאי השימוש.
