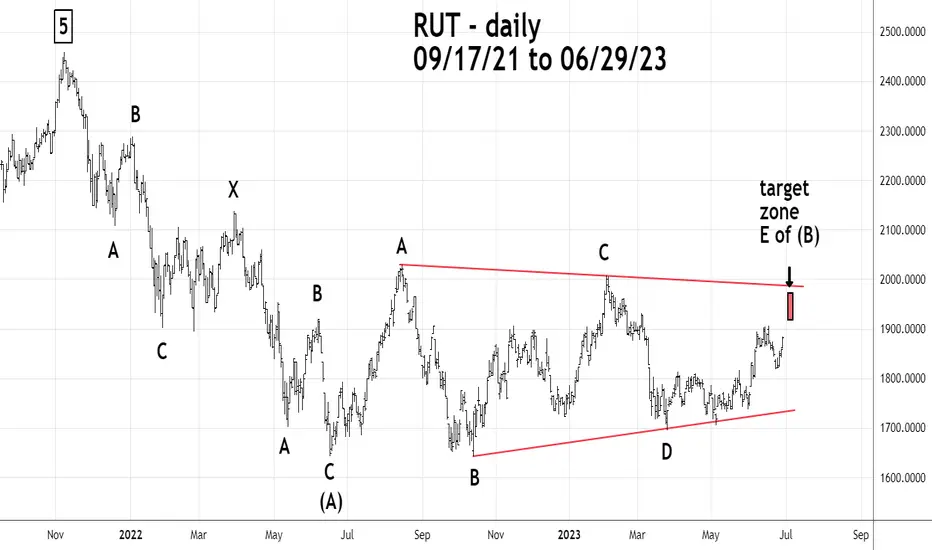
The Russell 2000 (RUT) from its high in November 2021 has a fascinating Elliott wave pattern.
The November 2021 to June 2022 is a Double Zigzag.
From June 2022 to the present it appears the RUT is forming a Horizontal Triangle which is a sideways correction pattern.
If correct, the pattern could complete sometime next week in the area of 1920 to 1975. If it completes RUT could then decline to at least the June 2022 possibly much lower.
פרסומים קשורים
כתב ויתור
המידע והפרסומים אינם אמורים להיות, ואינם מהווים, עצות פיננסיות, השקעות, מסחר או סוגים אחרים של עצות או המלצות שסופקו או מאושרים על ידי TradingView. קרא עוד בתנאים וההגבלות.
פרסומים קשורים
כתב ויתור
המידע והפרסומים אינם אמורים להיות, ואינם מהווים, עצות פיננסיות, השקעות, מסחר או סוגים אחרים של עצות או המלצות שסופקו או מאושרים על ידי TradingView. קרא עוד בתנאים וההגבלות.