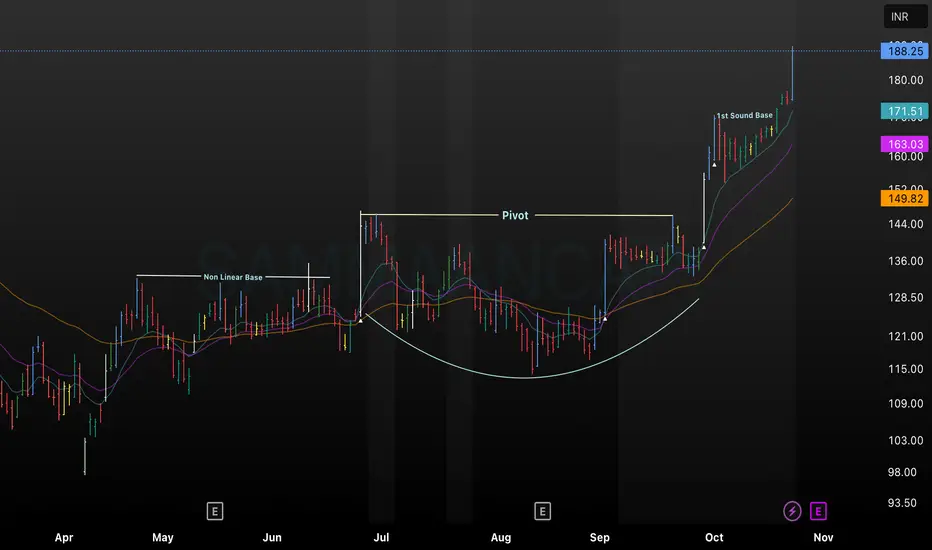
This TradingView chart displays a textbook Cup and Handle breakout pattern in Sammaan Capital (SAMMAANCAP). The setup begins with a “Non Linear Base,” transitions into an extended consolidation, and establishes a clear pivot zone before the breakout. A rapid surge follows, confirmed by the formation of the “1st Sound Base,” and supported by rising moving averages. This annotated chart is ideal for traders examining advanced base patterns and breakout behavior in Indian NBFC stocks, offering valuable reference for strategy building and technical analysis education
כתב ויתור
המידע והפרסומים אינם מיועדים להיות, ואינם מהווים, ייעוץ או המלצה פיננסית, השקעתית, מסחרית או מכל סוג אחר המסופקת או מאושרת על ידי TradingView. קרא עוד ב־תנאי השימוש.
כתב ויתור
המידע והפרסומים אינם מיועדים להיות, ואינם מהווים, ייעוץ או המלצה פיננסית, השקעתית, מסחרית או מכל סוג אחר המסופקת או מאושרת על ידי TradingView. קרא עוד ב־תנאי השימוש.
