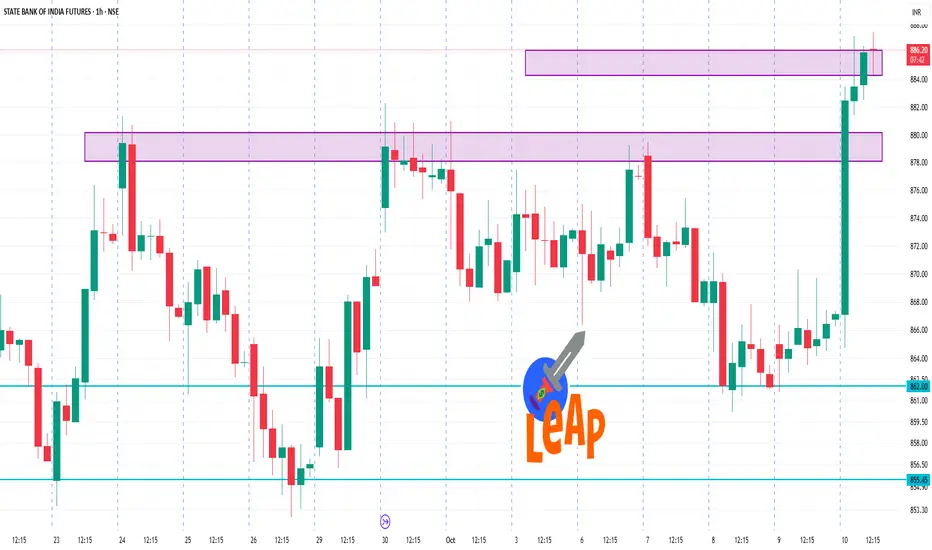
📈 1-Hour Time Frame Technical Overview
On the 1-hour chart, the technical indicators for SBIN futures are as follows:
Moving Averages: Strong Buy
Oscillators: Neutral
Overall Technical Rating: Strong Buy
This suggests a bullish short-term trend, with moving averages indicating upward momentum.
🔄 Key Levels to Watch
Based on recent intraday analysis, the following levels are noteworthy:
Resistance Levels: ₹880.88
Support Levels: ₹863.38
These levels can serve as potential entry or exit points for traders.
📊 Additional Insights
Open Interest: Approximately 94.62 million contracts, indicating active participation.
Volume: Around 13.07 million contracts traded, reflecting healthy liquidity.
פרסומים קשורים
כתב ויתור
המידע והפרסומים אינם מיועדים להיות, ואינם מהווים, ייעוץ או המלצה פיננסית, השקעתית, מסחרית או מכל סוג אחר המסופקת או מאושרת על ידי TradingView. קרא עוד ב־תנאי השימוש.
פרסומים קשורים
כתב ויתור
המידע והפרסומים אינם מיועדים להיות, ואינם מהווים, ייעוץ או המלצה פיננסית, השקעתית, מסחרית או מכל סוג אחר המסופקת או מאושרת על ידי TradingView. קרא עוד ב־תנאי השימוש.