### 🚢 **Shipping Corporation of India – Weekly Breakout Setup**
**Chart Type:** Weekly (1W)
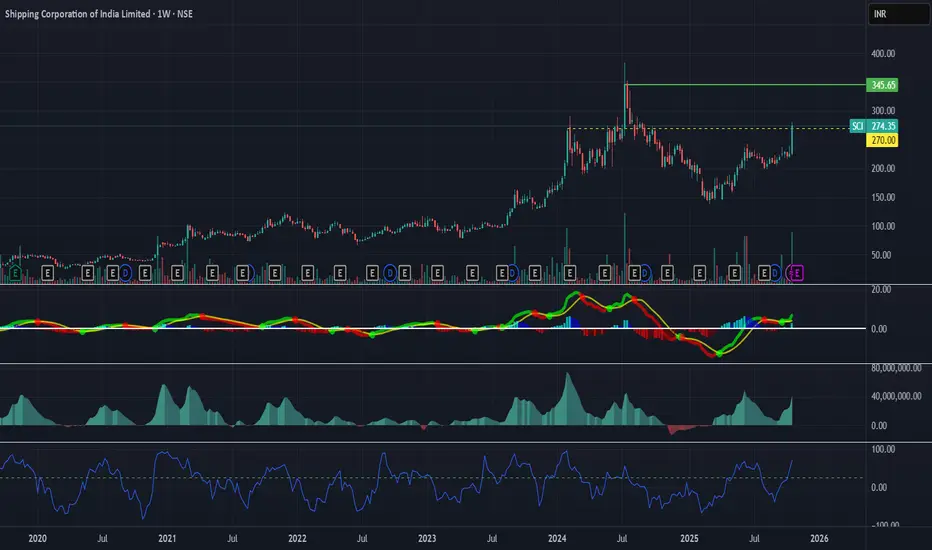
**CMP:** ₹274.35
**Resistance Zone:** ₹270–₹280 (Breakout Zone)
**Next Major Target:** ₹345
**Support Zone:** ₹225–₹230
---
### 📊 **Technical View:**
* After a long consolidation between ₹180–₹270, **SCI has given a strong breakout** with volume confirmation.
* **MACD crossover** on the weekly timeframe signals a new bullish cycle starting.
* **RSI rising above 60** indicates strong momentum build-up.
* Volume expansion supports accumulation and trend continuation.
---
### 🎯 **Trade Plan:**
| Action | Level | Comment |
| ------------ | ------------------------------ | ----------------------------------------- |
| **Entry** | ₹275–₹280 (Weekly Close Basis) | Wait for a strong candle close above ₹280 |
| **Stoploss** | ₹225 (Weekly Closing Basis) | Below previous swing low |
| **Target 1** | ₹320 | Partial booking |
| **Target 2** | ₹345 | Positional target |
| **Target 3** | ₹400+ (Long Term) | If breakout sustains |
---
### ⚙️ **Setup Type:**
✅ Positional / Swing Trade
⏰ Timeframe: 4–8 Weeks
📈 Risk–Reward: ~1:2.5
---
### 🔮 **Arthavidhi View:**
SCI is showing a **trend reversal from bottom** with strong volume and MACD confirmation. If ₹280 sustains, it can head toward ₹345 in coming weeks. Watch for follow-through candles and sector momentum in Shipping/Logistics stocks.
כתב ויתור
המידע והפרסומים אינם אמורים להיות, ואינם מהווים, עצות פיננסיות, השקעות, מסחר או סוגים אחרים של עצות או המלצות שסופקו או מאושרים על ידי TradingView. קרא עוד בתנאים וההגבלות.
כתב ויתור
המידע והפרסומים אינם אמורים להיות, ואינם מהווים, עצות פיננסיות, השקעות, מסחר או סוגים אחרים של עצות או המלצות שסופקו או מאושרים על ידי TradingView. קרא עוד בתנאים וההגבלות.