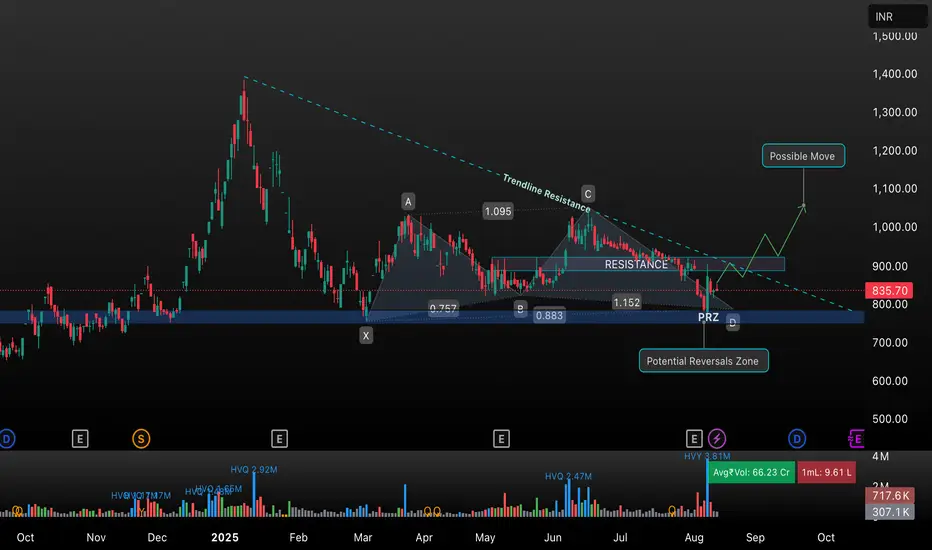
In this analysis, we review the daily chart of Shakti Pumps (SHAKTIPUMP) as presented on TradingView. The stock is currently trading at ₹835.70 and is approaching a crucial trendline resistance. The chart highlights:
• Bearish Trendline Resistance: Connecting recent highs.
• Key Support Zone: Identified as the “Potential Reversal Zone (PRZ)” between ₹750-₹850.
• Bullish Reversal Pattern: The stock has retested the PRZ multiple times, indicating strong support.
• Breakout Setup: A breakout above the resistance could trigger a move towards ₹1,100-₹1,200 as marked in the “Possible Move” target zone.
• Volume Analysis: Observing significant trading volumes at key zones.
Trading Idea:
If the stock breaks above the highlighted resistance and trendline, there is a potential for a strong bullish move. Watch for confirmation and manage risk accordingly.
עסקה פעילה
Volume Surged כתב ויתור
המידע והפרסומים אינם אמורים להיות, ואינם מהווים, עצות פיננסיות, השקעות, מסחר או סוגים אחרים של עצות או המלצות שסופקו או מאושרים על ידי TradingView. קרא עוד בתנאים וההגבלות.
כתב ויתור
המידע והפרסומים אינם אמורים להיות, ואינם מהווים, עצות פיננסיות, השקעות, מסחר או סוגים אחרים של עצות או המלצות שסופקו או מאושרים על ידי TradingView. קרא עוד בתנאים וההגבלות.