Shiba Inu (SHIB) technical analysis:
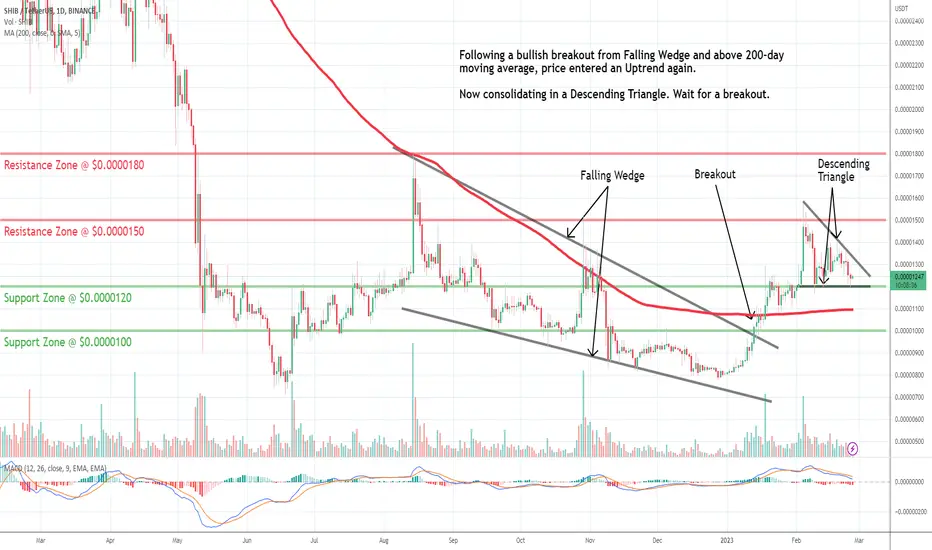
Trade setup: Following a bullish breakout from Falling Wedge and above 200-day moving average, price entered an Uptrend again. Now it’s consolidating in a from Descending triangle Pattern. Wait for a breakout.
Trend: Neutral on Short-Term basis and Uptrend on Medium- and Long-Term basis.
Momentum is Mixed as MACD Line is below MACD Signal Line (Bearish) but RSI ~ 50 (Neutral).
Support and Resistance: Nearest Support Zone is $0.000012 (previous resistance), then $0.000010. The nearest Resistance Zone is $0.000015, then $0.0000180.
כתב ויתור
המידע והפרסומים אינם אמורים להיות, ואינם מהווים, עצות פיננסיות, השקעות, מסחר או סוגים אחרים של עצות או המלצות שסופקו או מאושרים על ידי TradingView. קרא עוד בתנאים וההגבלות.
כתב ויתור
המידע והפרסומים אינם אמורים להיות, ואינם מהווים, עצות פיננסיות, השקעות, מסחר או סוגים אחרים של עצות או המלצות שסופקו או מאושרים על ידי TradingView. קרא עוד בתנאים וההגבלות.