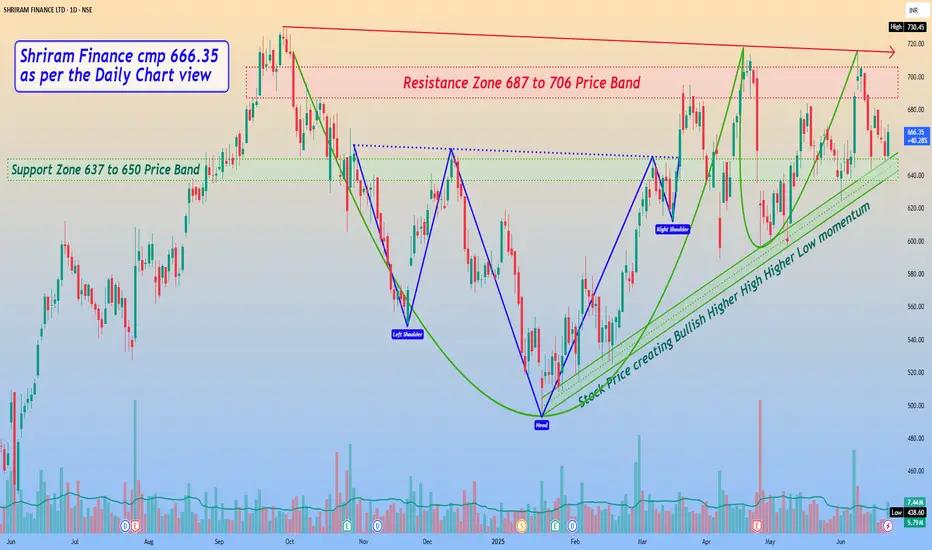
*Shriram Finance cmp 666.35 by Daily Chart view*
- Support Zone 637 to 650 Price Band
- Resistance Zone 687 to 706 Price Band
- *Stock Price creating Bullish Higher High Higher Low momentum*
- Volumes are seen to be in good sync with average traded quantity
- *Price seems testing and retesting the Support Zone over last week*
- Stock made few failed attempts to cross the ATH 730.45 and reversed
- Falling Resistance Trendline and Resistance Zone are good hurdles to crossover
- *Bullish Rounding Bottoms above Resistance Zone neckline and considerate Head & Shoulders is seen*
כתב ויתור
המידע והפרסומים אינם אמורים להיות, ואינם מהווים, עצות פיננסיות, השקעות, מסחר או סוגים אחרים של עצות או המלצות שסופקו או מאושרים על ידי TradingView. קרא עוד בתנאים וההגבלות.
כתב ויתור
המידע והפרסומים אינם אמורים להיות, ואינם מהווים, עצות פיננסיות, השקעות, מסחר או סוגים אחרים של עצות או המלצות שסופקו או מאושרים על ידי TradingView. קרא עוד בתנאים וההגבלות.