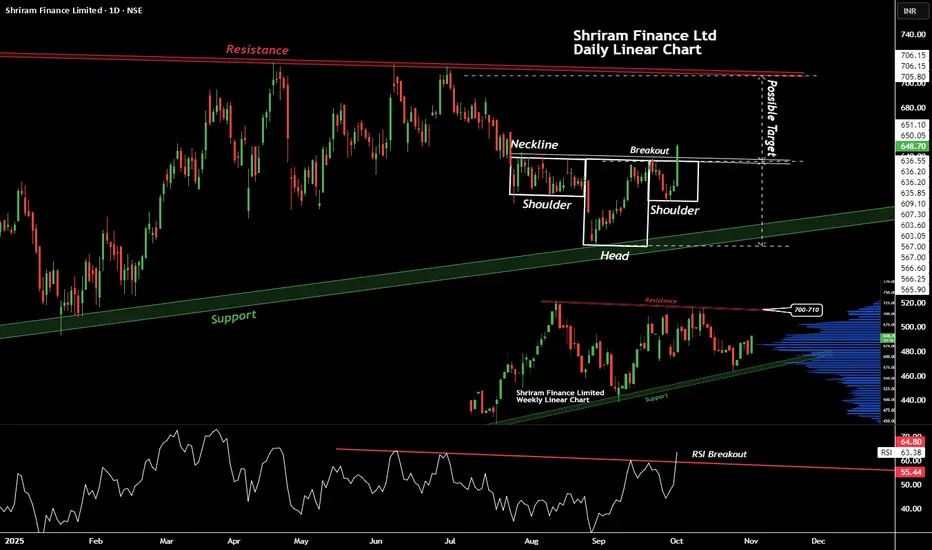
We can witness curious case of Mother pattern and a Child pattern here. In the caption image (right lower corner) we can see a bullish pattern of Ascending Triangle (not counting waves at the moment), to complete present wave stock must reach 700 to 710 levels, we can confirm same with child pattern of Head & Shoulder. Positive things about this stock are:-
Stock bouncing back from weekly support zone (Mother Pattern).
There is a breakout (Child Pattern).
Bullish with Momentum breakout (Child Pattern).
RSI breakout on daily timeframe, approving momentum.
Highest Volume activity (Mother Pattern), traders are taking interest.
Target of Child Pattern confirms with Resistance boundaries of Mother Pattern.
Though there is an EMA support on Mother pattern, not visible here as i checked it later.
Shriram Finance Ltd is a quality F&O stock, one can add on retest or at current prices for the small target of 700-710 in coming times. Always prepare for worse, in case of some bad news, some geo-political event or volatility, always apply some logical stoploss, you can go for HA lows or Swing lows.
Thanks, Happy Trading.
כתב ויתור
המידע והפרסומים אינם מיועדים להיות, ואינם מהווים, ייעוץ או המלצה פיננסית, השקעתית, מסחרית או מכל סוג אחר המסופקת או מאושרת על ידי TradingView. קרא עוד ב־תנאי השימוש.
כתב ויתור
המידע והפרסומים אינם מיועדים להיות, ואינם מהווים, ייעוץ או המלצה פיננסית, השקעתית, מסחרית או מכל סוג אחר המסופקת או מאושרת על ידי TradingView. קרא עוד ב־תנאי השימוש.