After a period of decline following its February 2024 peak, Sigachi Industries has shown a dramatic burst of momentum. However, the stock has now reached a critical juncture, and confirmation is required to suggest a sustainable trend reversal.
## Recent Price Action
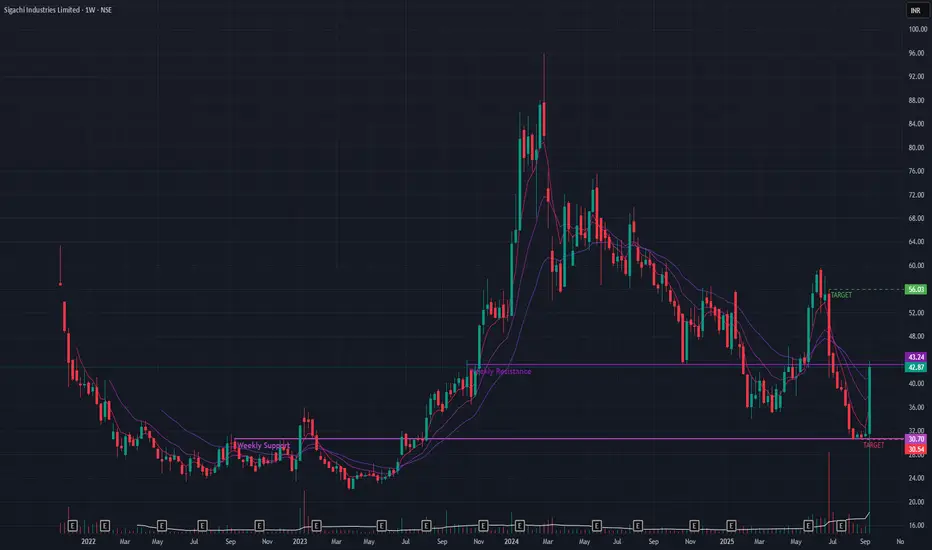
A massive +36.27% rally last week, backed by exceptionally high volume, has put the stock back on the radar. This surge has pushed the price directly against a significant long-term resistance trendline. A breakout above this level would be a major technical victory for the bulls.
## Cautionary Signals to Consider
Despite the powerful rally, several indicators suggest a "wait-and-see" approach:
Trend Confirmation: The stock has not yet formed a higher low, a key technical signal required to confirm a reversal from a downtrend to an uptrend.
EMA Posture: The short-term Exponential Moving Averages (EMAs) have not yet achieved a Positive Crossover (PCO). This indicates that the recent surge, while strong, has not yet been sustained long enough to reverse the short-term trend momentum.
## Key Levels and Outlook
The stock is at a clear decision point.
Bullish Scenario: A decisive breakout above the current resistance trendline, again on high volume, would be a strong bullish signal. If this occurs, the next potential upside target is the ₹56 level.
Bearish Scenario: If the stock fails to breach this resistance and the momentum fades, it could fall back to test support near the ₹30 level.
Wait for further price-action !!
## Recent Price Action
A massive +36.27% rally last week, backed by exceptionally high volume, has put the stock back on the radar. This surge has pushed the price directly against a significant long-term resistance trendline. A breakout above this level would be a major technical victory for the bulls.
## Cautionary Signals to Consider
Despite the powerful rally, several indicators suggest a "wait-and-see" approach:
Trend Confirmation: The stock has not yet formed a higher low, a key technical signal required to confirm a reversal from a downtrend to an uptrend.
EMA Posture: The short-term Exponential Moving Averages (EMAs) have not yet achieved a Positive Crossover (PCO). This indicates that the recent surge, while strong, has not yet been sustained long enough to reverse the short-term trend momentum.
## Key Levels and Outlook
The stock is at a clear decision point.
Bullish Scenario: A decisive breakout above the current resistance trendline, again on high volume, would be a strong bullish signal. If this occurs, the next potential upside target is the ₹56 level.
Bearish Scenario: If the stock fails to breach this resistance and the momentum fades, it could fall back to test support near the ₹30 level.
Wait for further price-action !!
Disclaimer: This analysis is my personal view & for educational purposes only. They shall not be construed as trade or investment advice. Before making any financial decision, it is imperative that you consult with a qualified financial professional.
כתב ויתור
המידע והפרסומים אינם מיועדים להיות, ואינם מהווים, ייעוץ או המלצה פיננסית, השקעתית, מסחרית או מכל סוג אחר המסופקת או מאושרת על ידי TradingView. קרא עוד ב־תנאי השימוש.